My clients bring the people and the problem. I design how it's solved.
I work on land, governance, and environmental decisions, the kind where the stakes are real, the interests are genuinely different, and the outcome has to hold. My clients include First Nations, government bodies, and multi-stakeholder coalitions.
Approach
The problems that matter most don't have easy answers, and the people who need to act on them are often moving further apart rather than closer together.
Who’s at the table.
Every engagement starts with a question. Who needs to be in this conversation, and why? From there, I design the structures that give the work a place to live: terms of reference, governance relationships, participant mix.
How it works.
A well-designed process does more than move people through an agenda. It gives a group a way to understand each other, to surface what people actually care about, and to find a place they can move forward from together.
In the room.
I work in the room. That means reading what's actually happening, adjusting in real time, and being the person who names a difficult moment before it derails the work.
Making sense of it.
Complex processes produce complex information. I turn that into findings people can act on. What was said, what it means, what comes next.
Work
A selection of engagements from twenty years of practice.
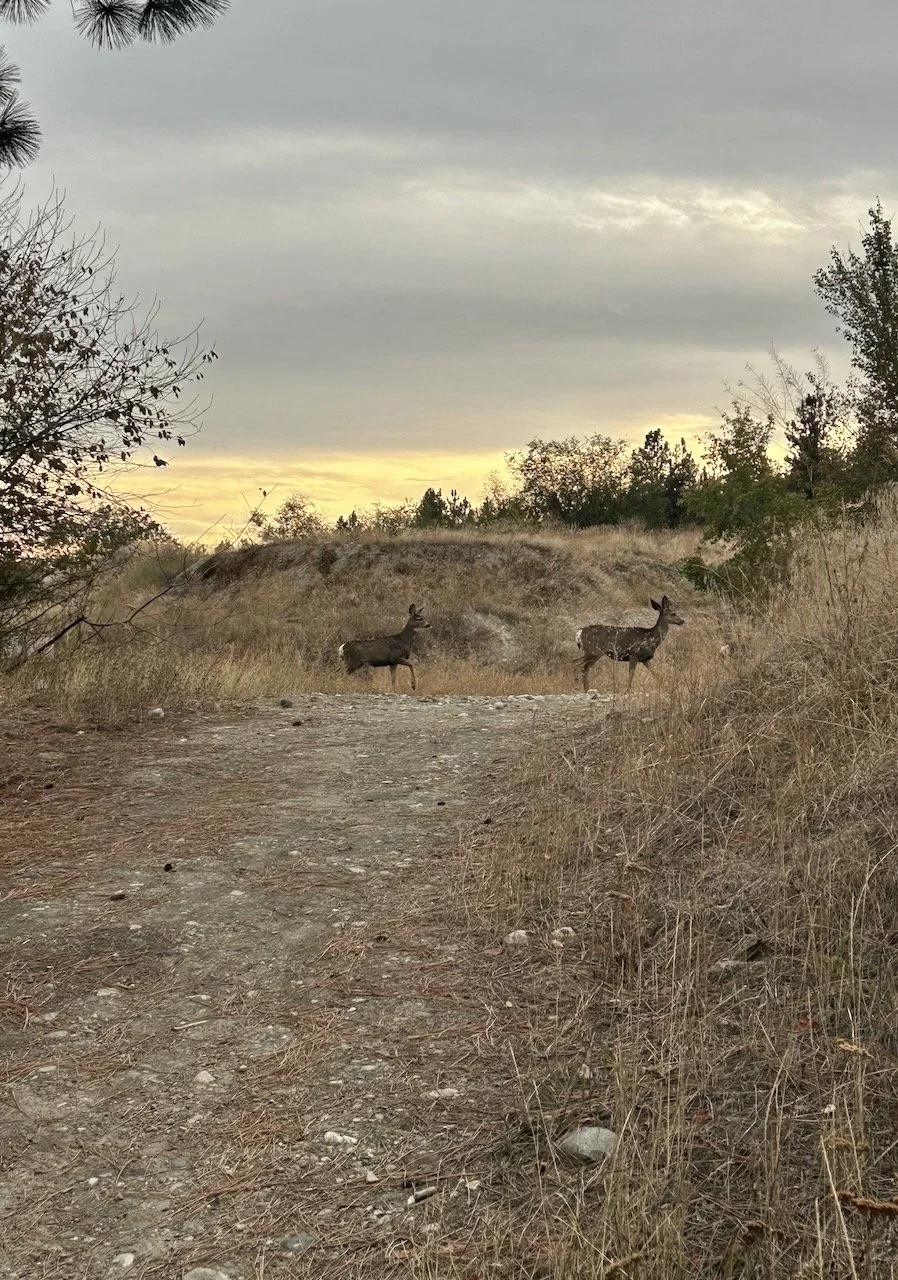
Ecological Corridors & Crossings Forum
2025 - Process Design and Facilitation
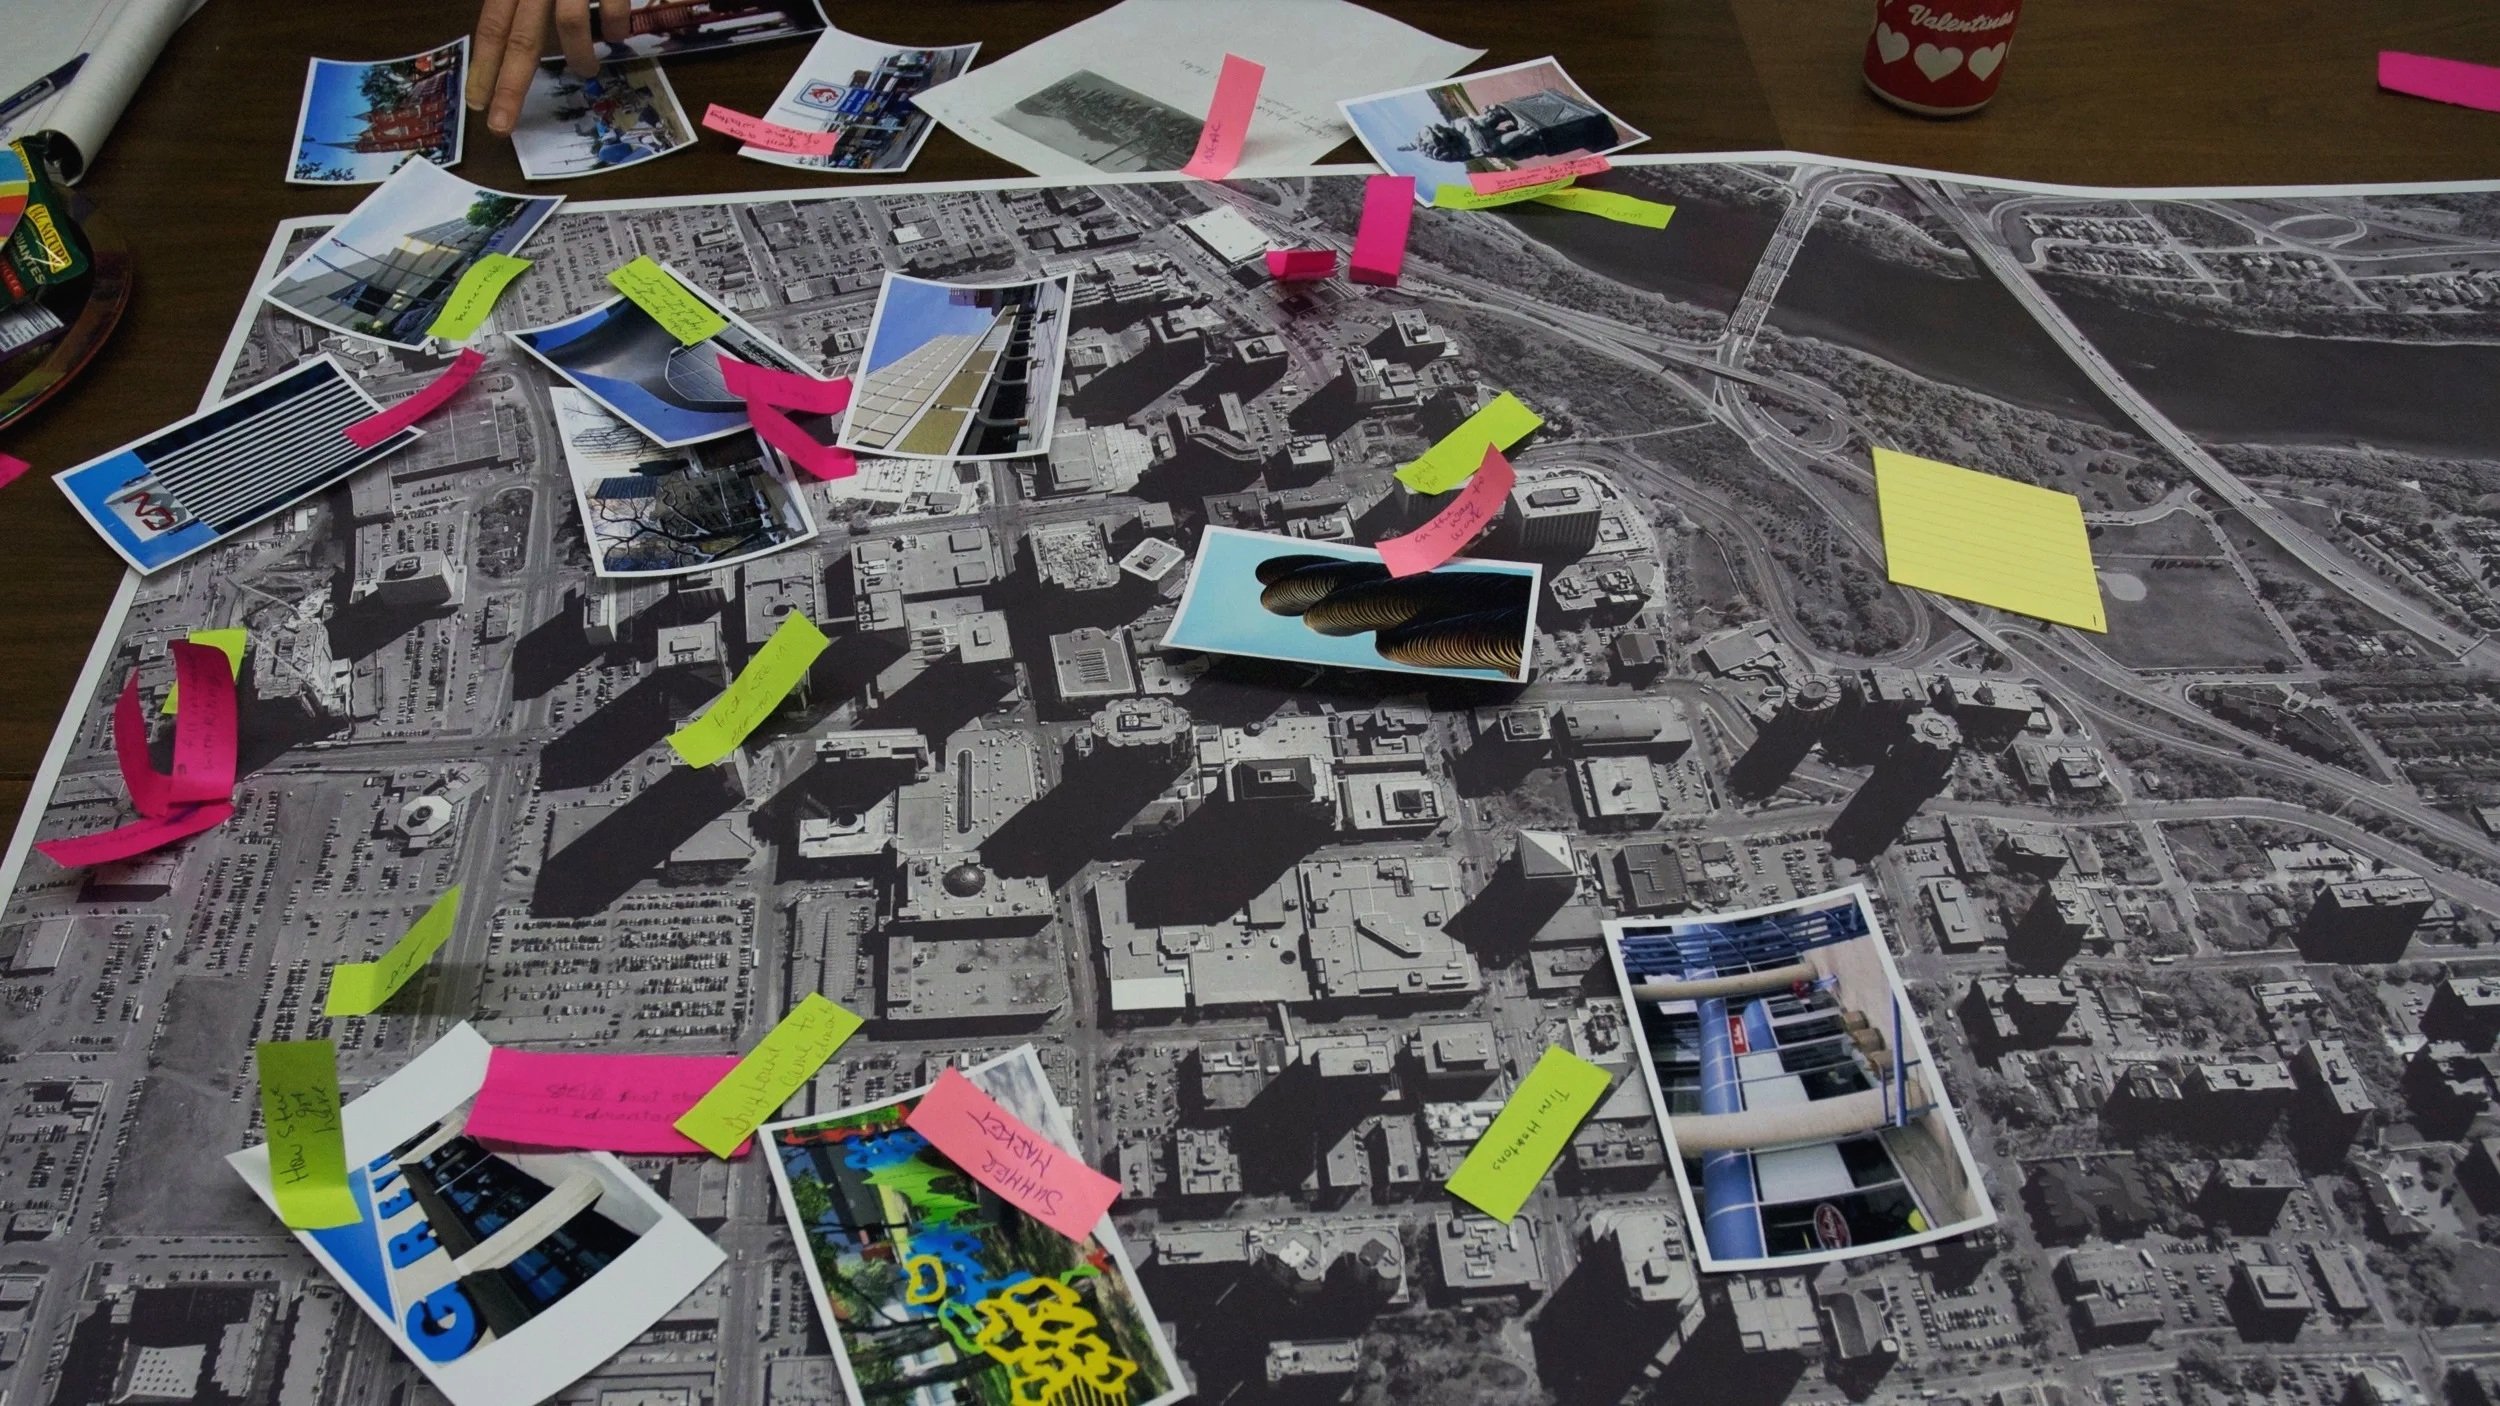
Designed and led a three-day forum in Kelowna bringing together fifty participants from First Nations, government, NGOs, and academic institutions, everyone whose knowledge and relationships are needed to make wildlife corridors work in BC's Southern Interior. Field tours and mapping exercises replaced the conventional conference format.
Outcome: 24-month priority recommendations for wildlife corridor work in BC's Southern Interior, agreed by all fifty participants.
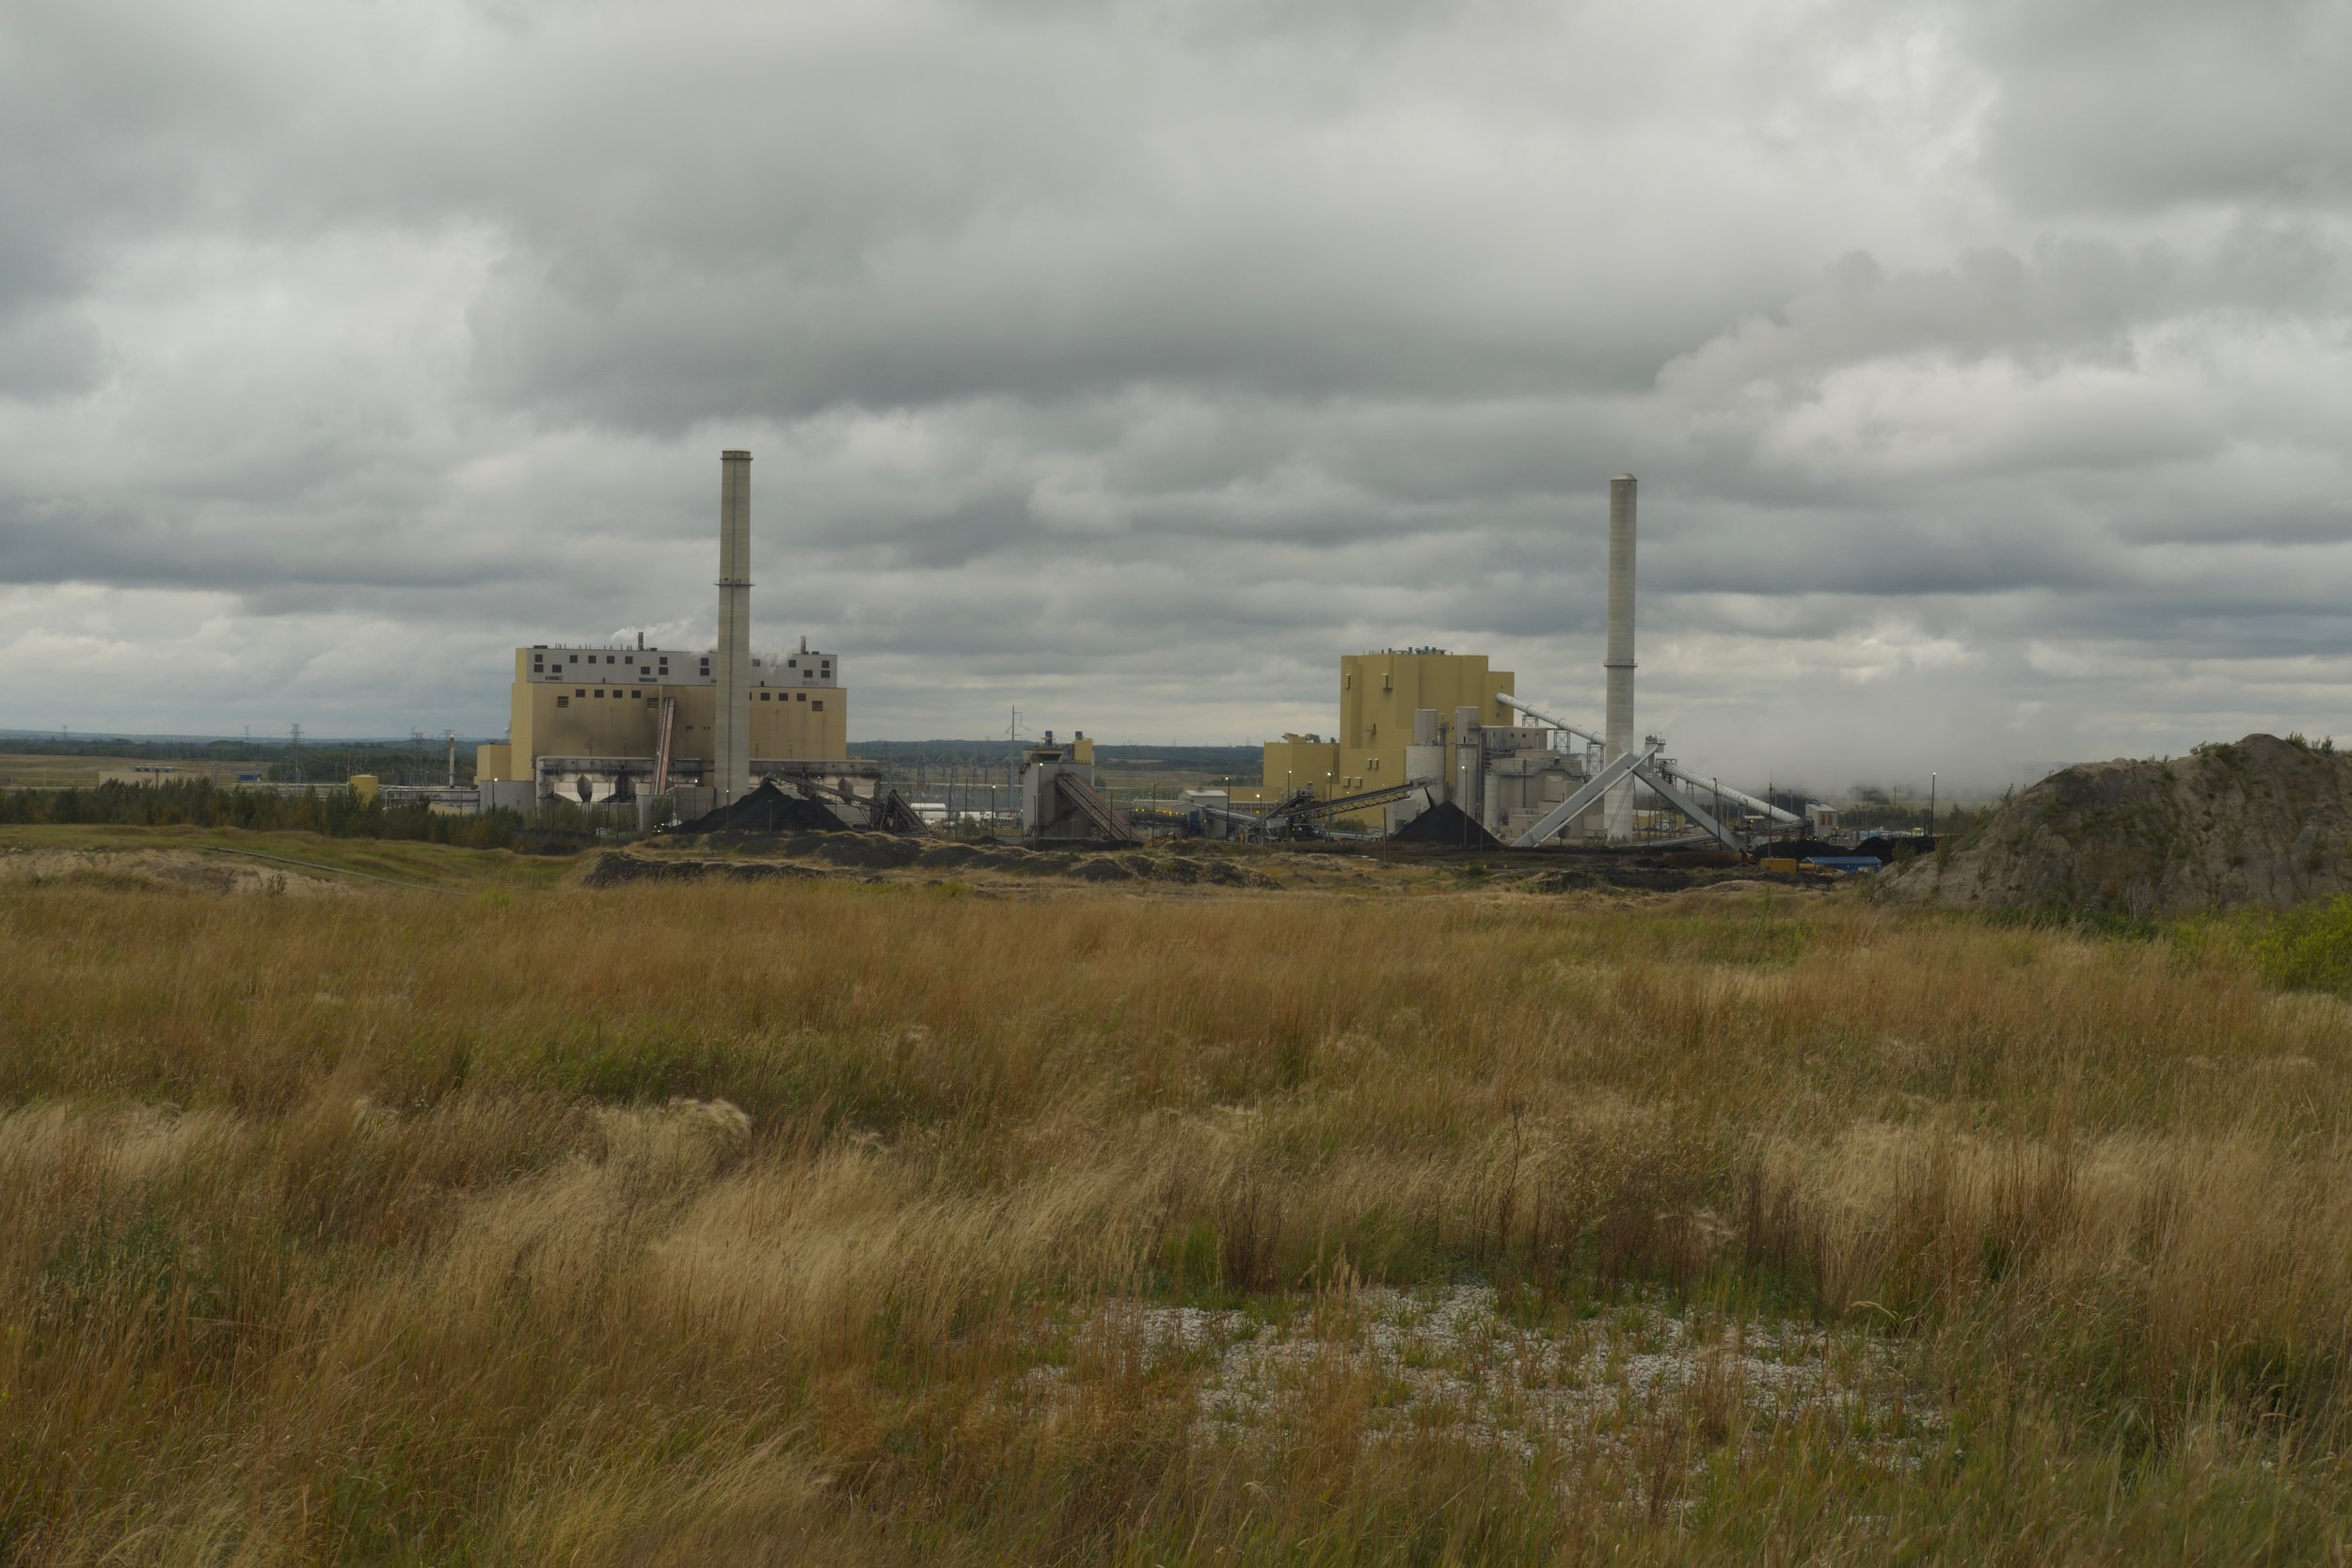
CASA Coal-to-Gas NOx Standard Development
2017 - Process Design and Facilitation for the Clean Air Strategic Alliance
Designed and led a six-week consensus process to develop an emissions standard for Alberta's coal-fired electricity units converting to natural gas, requested by the Deputy Minister with a firm deadline. Utilities with major investment decisions on the line, environmental NGOs, and affected communities reached unanimous agreement in five meeting days. The standard was subsequently adopted by the Government of Alberta.
Outcome: An emissions standard for coal-to-gas conversion adopted by the Government of Alberta. The standard remains in force.
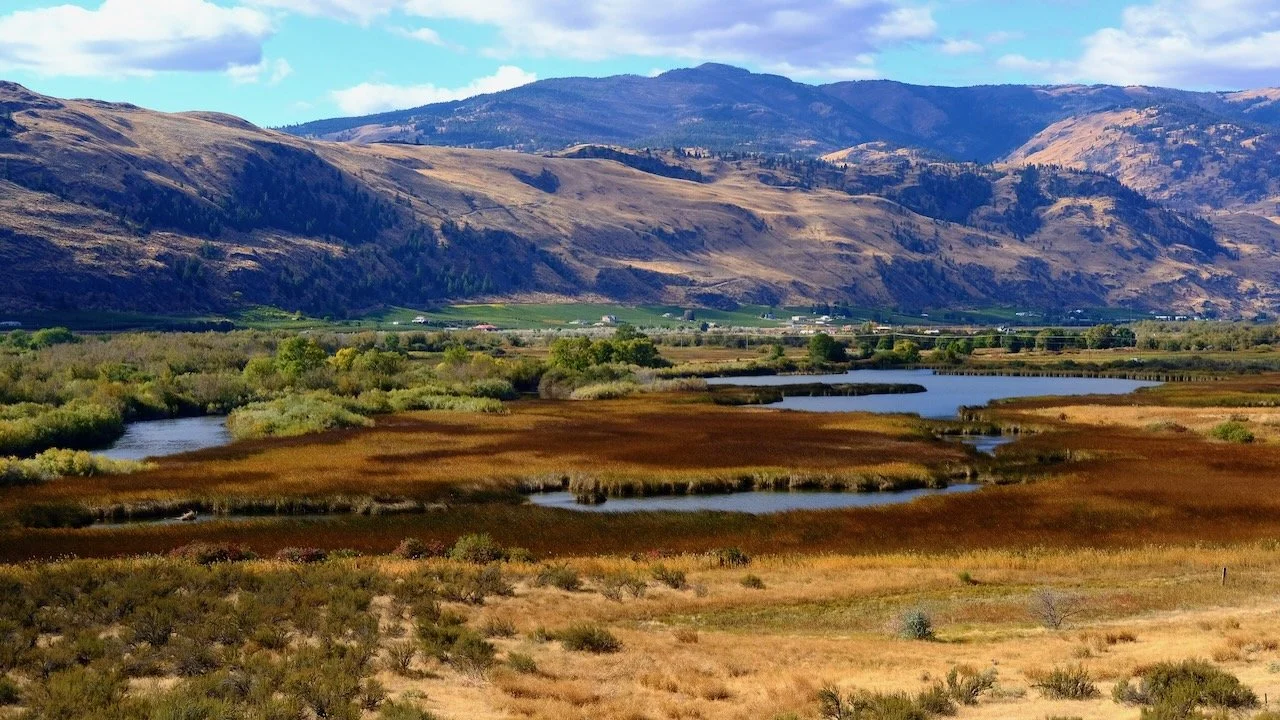
Syilx / Okanagan Boundary Wildlife Advisory Committee
2025 - Process Design and Facilitation
Designed and facilitated the formation of a regional wildlife advisory committee under BC's Together for Wildlife Strategy, bringing together Syilx Nation members, Knowledge Holders, and Elders alongside non-Indigenous hunters, trappers, and conservation advocates. The work began as two separate groups. Trust was built slowly. The committee produced a formal advisory letter recommending co-led land use planning that was endorsed by all eight ONA member communities.
Outcome: A formal advisory letter recommending co-led land use planning, endorsed by all eight ONA member communities together with non-Indigenous hunters, trappers, and conservation advocates. Submitted to the BC Ministry of Water, Land and Resource Stewardship.
City of Edmonton Naming Committee
2021-25 - Committee member, Vice Chair and Chair
Names are public decisions. They shape how people understand a place, whose history gets recognized, and what a community values. I've served on the City of Edmonton's Naming Committee since 2021, as a member, Vice Chair for two years, and Chair for two years.
The role covers more ground than it might sound. I chair meetings, report annually to City Council on the committee's membership and activities, represent the City on external naming processes, and work with members to develop strategic direction. I also develop naming proposals and support the Indigenous Relations Office in their leadership on Indigenous-led naming processes.
Outcome: Approved place name applications across two terms as Chair and 4 terms as a member, and led the development of an Indigenous-informed naming policy framework currently in development.
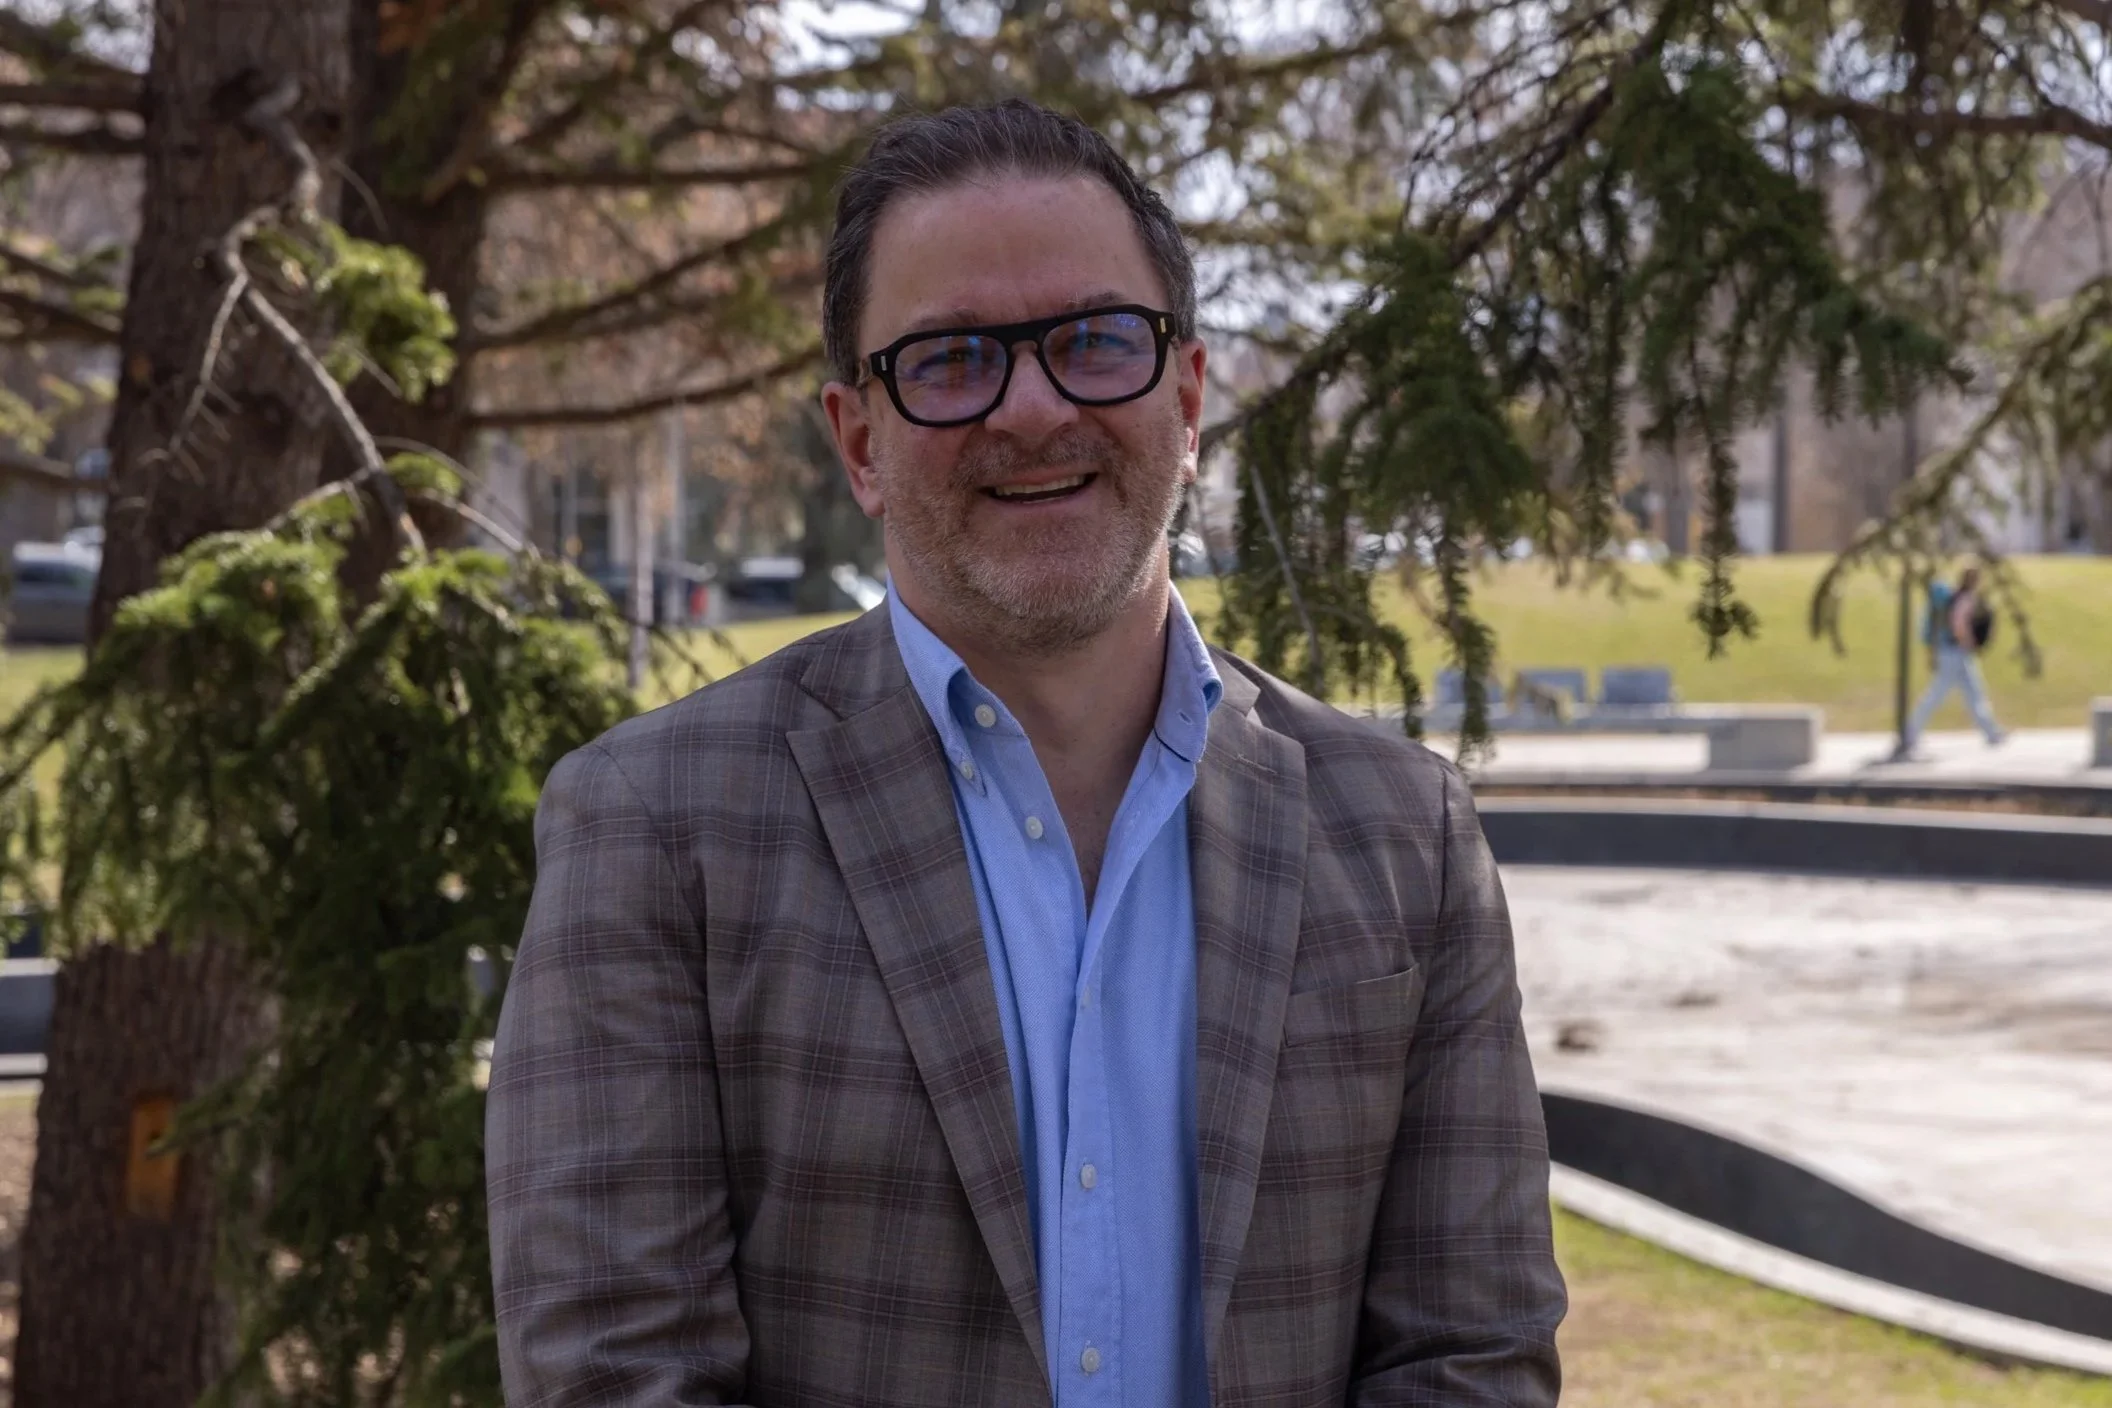
About
For over two decades I’ve worked at the intersection of process and relationships with governments, Indigenous Nations, NGOs, and regional collaboratives on complex environmental and land-use challenges. My starting point is always the same: who needs to be in this conversation, and why?
Working at the Clean Air Strategic Alliance was foundational. Running one to two multi-interest meetings per week under the mentorship of skilled consensus practitioners, I developed the core skills that still underpin everything: how to set up a room, get agreement on language, and do the quiet background work that helps people understand what they actually care about before they have to say it out loud.
I am based in Treaty 6 territory. I work across western Canada.
Fit
I work best with groups that have to agree on something and where the people in the room have the authority to act and the willingness to stay in the conversation when it gets hard. I'm not the right fit for engagement that's already been decided, or for processes that need a single voice steering the outcome. If you're not sure which kind you need, that's a useful conversation in itself.
The best way to start is a short conversation. I'll ask the same questions I ask at the beginning of every engagement: what problem are you trying to solve, who needs to be in this conversation, and why?
Thirty minutes usually tells us both whether there's a fit.