Gentrification: Building Permits in Edmonton's Downtown Neighbourhoods
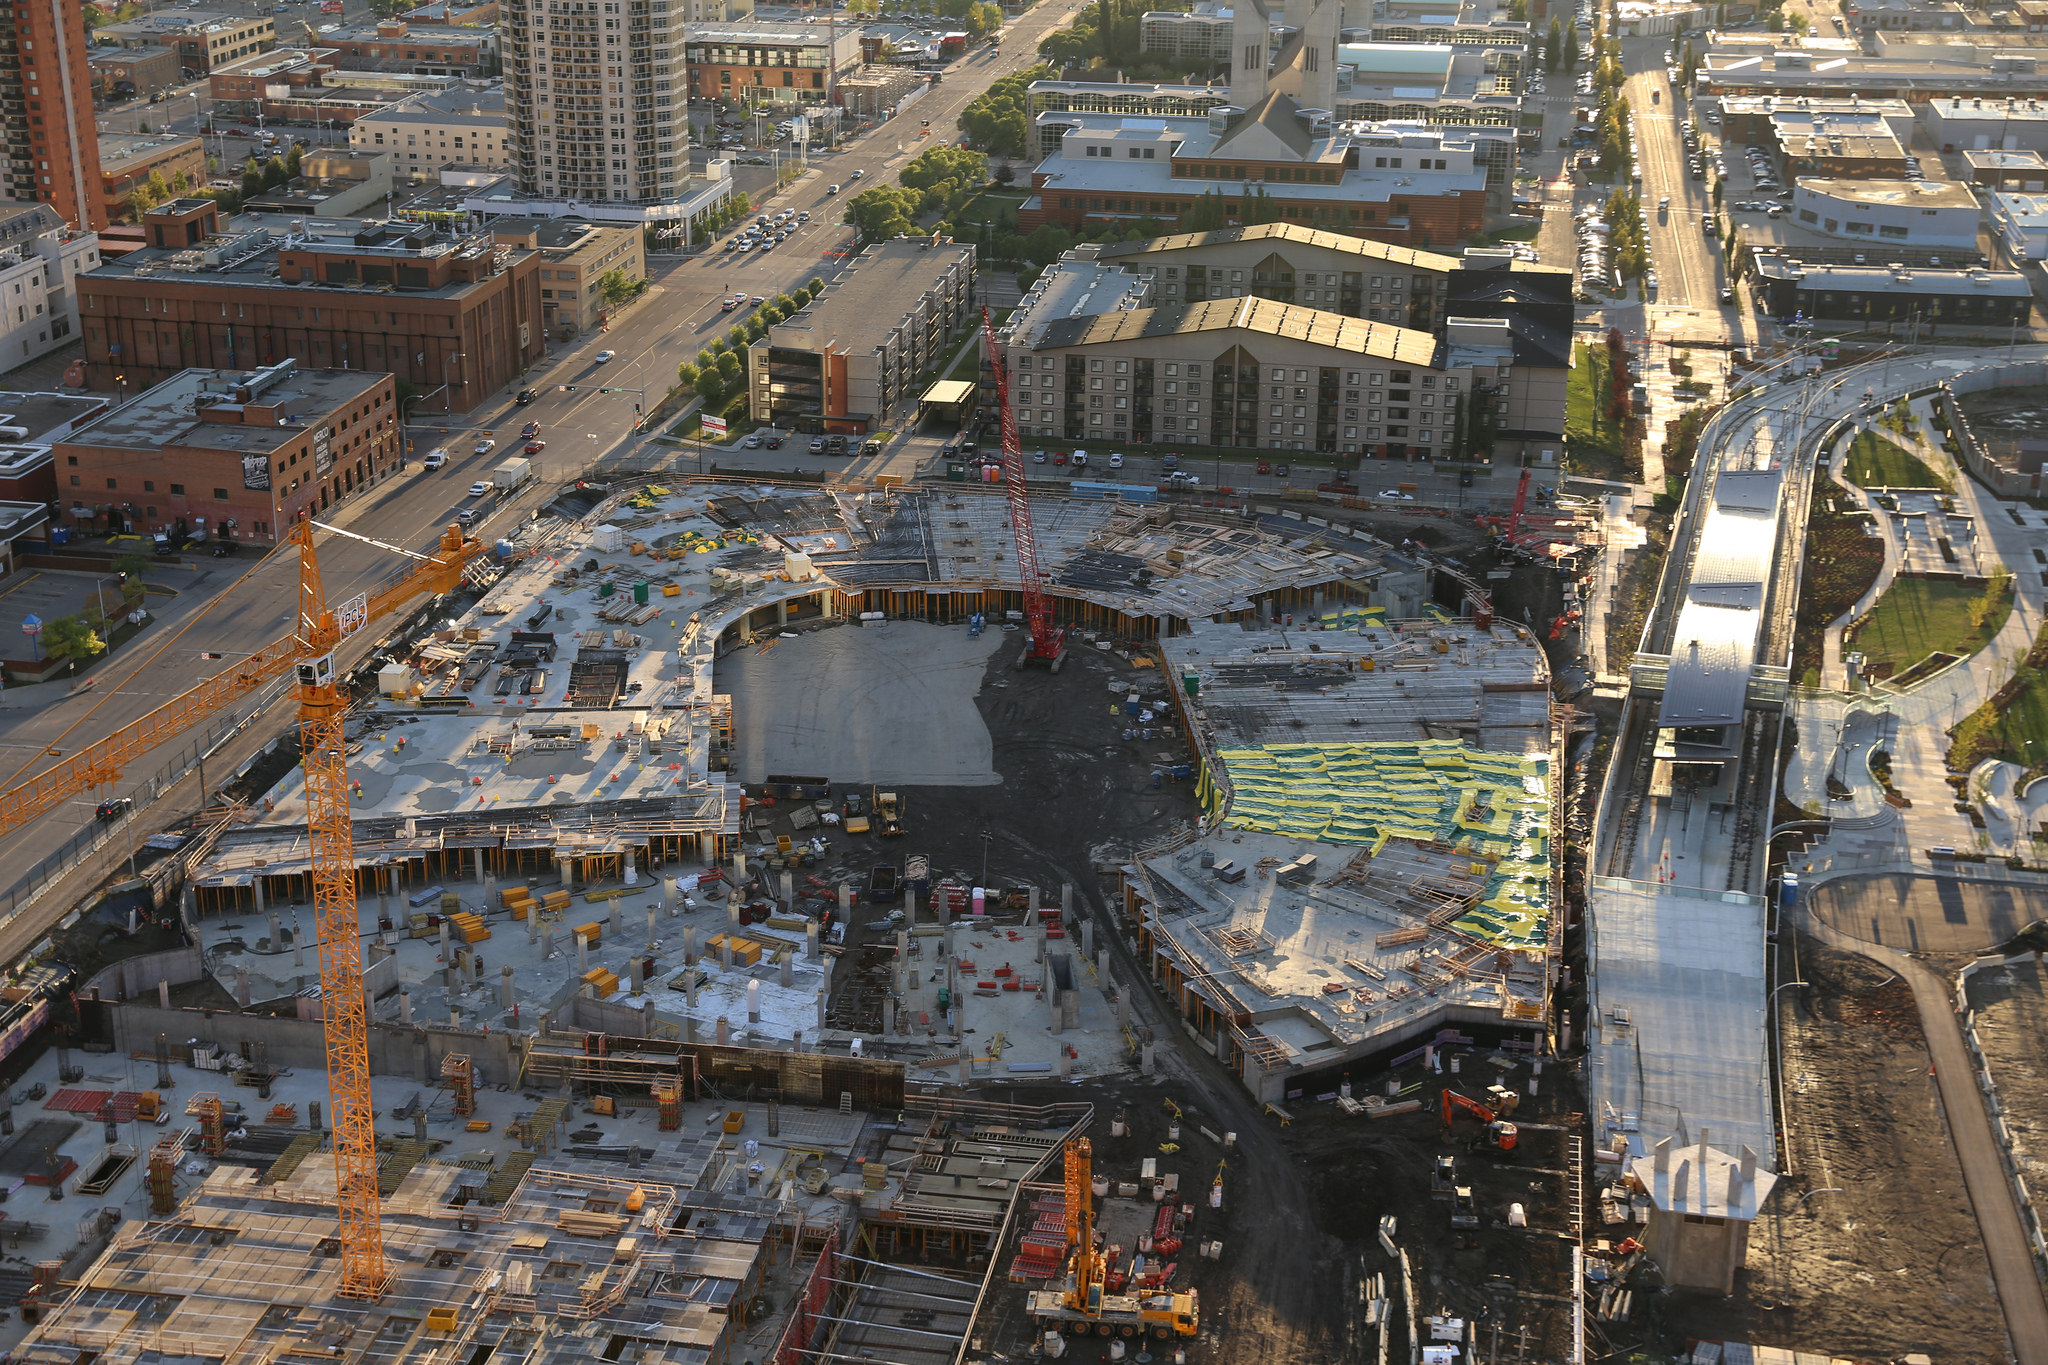
Edmonton's Arena, perhaps most symbolic of downtown development. Photo by Mack Male.
Edmonton's downtown core and surrounding neighborhoods are undergoing some pretty serious development. In an effort to focus my thinking, I looked at the building permit data from 2009-2015 (NOTE: 2015 is not a complete data set), from the City of Edmonton Open Data Portal, for the following neighbourhoods:
Boyle
Central McDougal
Cromdale
McCauley
Oliver
Queen Mary Park
Riverdale
Rossdale
Westmount
Downtown
What follows is an overview of what I saw in that data.

Figure 1: Annual development estimate from building permit data for 4 downtown core Edmonton neighbourhoods (2009-2014)
Figure 1 includes the neighbourhoods of Downtown, Oliver, Boyle and McCualy. Downtown's curve is a reflection of various commercial permits with a spike of investment promised in 2010 (coincides with the approval of the Capital City Downtown Plan in July 2010) and again in 2015. Oliver's curve is a reflection of both residential development until 2012, and the bump in 2013/14 reflects investment in the Brewery District. Boyle is seeing development as part of the Quarters and is mostly commercial (See Figure 4) and McCauley development is being driven by mostly residential, retail and a small amount of commercial (see Figure 4).

Figure 2: Annual development estimates from building permit data for 6 downtown Edmonton neighbourhoods. (2009-2014).
Figure 2 is more modest in that the dollar amounts are hundreds of thousands to tens of million dollars, rather than 100's of millions+ represented in Figure 1. All of these neighbourhoods are seeing a mix of development between commercial, residential and retail. I will discuss these neighbourhoods more later.

Figure 3: Estimated building permit value 2009-2015. Purple circles are worth 100 million (for the smaller purple) and 200 million plus, green circles are 1 million to 10 million, yellow circles are lees then 100 000, and the small yellow dots are less then 50 000. Multiple circles around a single point indicates multiple building permits were granted for that location.
In combination, Figure 1, 2 and 3 tells me (unsurprisingly) that vast majority of Edmonton's big projects are occurring in the downtown core, with a large number of smaller projects happening in adjacent neighborhoods. These projects comprise a mix of new developments (like the arena) and redevelopments such as City Centre Mall.
My initial concern was that Boyle Street was being gentrified. Smith (1982) defines gentrification narrowly as "... the process by which working class residential neighborhoods are rehabilitated by middle class homebuyers, landlords and professional developers.". This indicates, by Smith's narrow definition, that Boyle Street is not being gentrified, as no working class people are being displaced by the developments being built there. This is true, and was reflected in the comments on my last gentrification blog - Most of the developments are occurring on undeveloped land, and very few of them are residential (see Figure 3).
Smith's definition of gentrification does address those who own or rent, but not those who don't or those who are transient. In other words, homeless people can be displaced from the places that use on a daily basis, and not really count within Smith's scope. And while I don't know how to measure this (the displacement of homeless people), I wonder who of the uncounted is being displaced from Edmonton's downtown core, and most especially from the streets adjacent to the new arena development. This idea of "non-classical" gentrification will have to be explored later.

Figure 4: Permits by Building Classification. Small red dots are residences (apartments, condos, houses) and associated structures (detached garages, sheds, etc). Blue are engineering (infrastructure maintenance, utilities, hoarding, etc). Green are various retail, restaurants and bars. Yellow are offices. Rings, for instance a green dot ringed by yellow, indicates that a location has permits for both, as an example, retail and office.
The most interesting data from this dataset comes when Figure 2 and Figure 4 are looked at in combination. Relative to the downtown neighbourhoods, the neighbourhoods in Figure 2 have modest investments, but have seen jerky growth from 2009-2014. For instance, Riverdale as increased in dollars from 2.1M in 2009 to 5.8M in 2014; Rossdale from a low in 2009 of just over 400K to a high in 2014 of almost 9M. Referencing Figure 4, we can see that most of that money must be in residential development for both neighbourhoods (lots of red dots) as there are few yellow or green dots.
I wonder if these data point to gentrification occurring in neighbourhoods peripheral to the downtown core?
Finally, I would like to see a dollar breakdown between residential and commercial for the other peripheral neighbourhoods including Queen May Park, McCauley and Central McDougal. This should keep me busy for a few blog posts.
As always, please let me know what you think on Twitter, or in the comments section below.
REQUEST: I would love to look at residential building permits relative to residential housing sales. If anyone has access to all sales data for Edmonton from 2009-2014, please let me know as I could use the data.
Addendum, 11 December 2015
I thought that it was important to add a couple of maps:

Figure 5: The Quarter's Boundary. Small red dots are residences (apartments, condos, houses) and associated structures (detached garages, sheds, etc). Blue are engineering (infrastructure maintenance, utilities, hoarding, etc). Green are various retail, restaurants and bars. Yellow are offices.
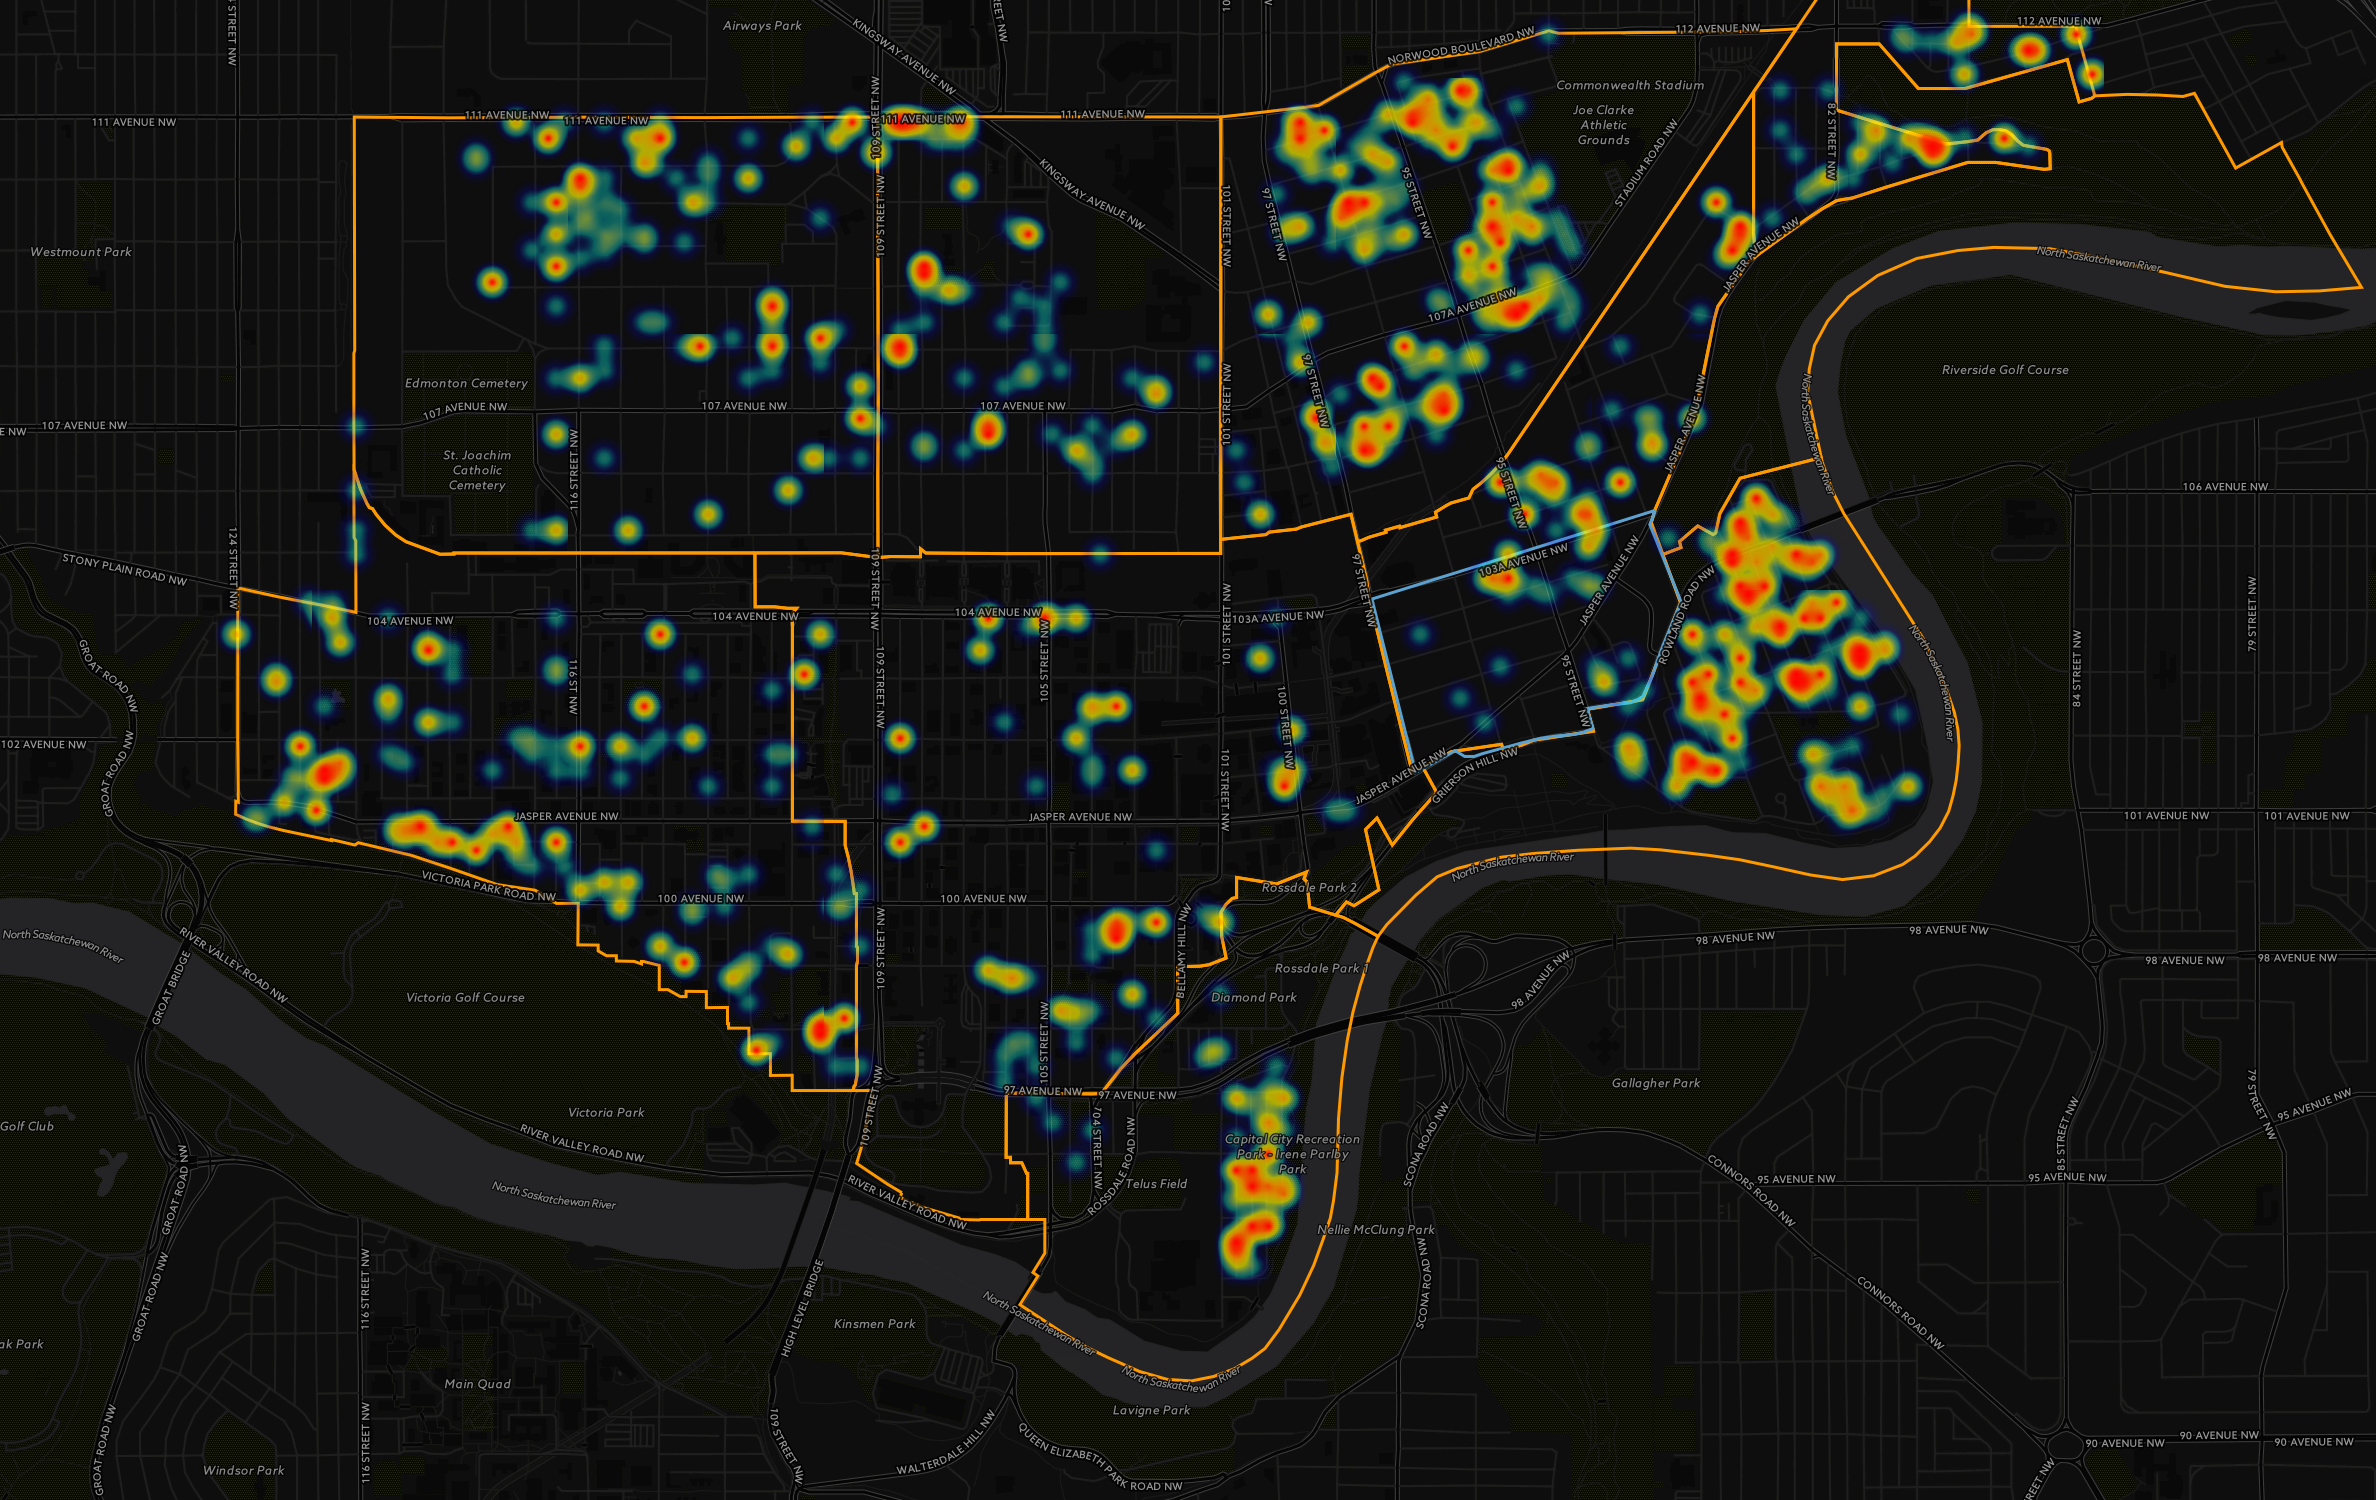
Figure 6: Heat map of Edmonton's downtown neighbourhoods. This heat maps is showing clusters of residential (all housing types) building permits.
Figure 5 shows at greater detail the development with the Quarter's district of Edmonton.
Figure 6 points to some of the hotspots of residential development. I am specifically interested in exploring 4 right now: 1: The Victoria Promenade (more for interest sake then gentrification); 2. Rossdale (this neighbourhood has been in the news lately and I am keen to understand what is happening there); 3. Riverdale - I am interested to dig deep and understand this neighbourhood from the time of the original brickworks, and finally; 4. McCauley.