Riverdale
Header photo by Randall (taken in 1991) from Flickr.
Introduction
The intent of this case study of Riverdale is twofold - to investigate how likely it is that Riverdale is being gentrified through an examination of a variety of data including income, ownership & rental rates, length of residence and building permits; and to test out my method of examination given the data that I have on hand.
Riverdale is a wealthy community with 44% of households earning over $100 000. A further 21% of households earn over $80 000, and 25% of households earn less than $50 000 per year. These data are form 2010 and are found in Riverdale's Demographic Profile produced by the City of Edmonton. All other data reported in the post are from the City of Edmonton's open data catalogue.
Ownership and Rental Rates
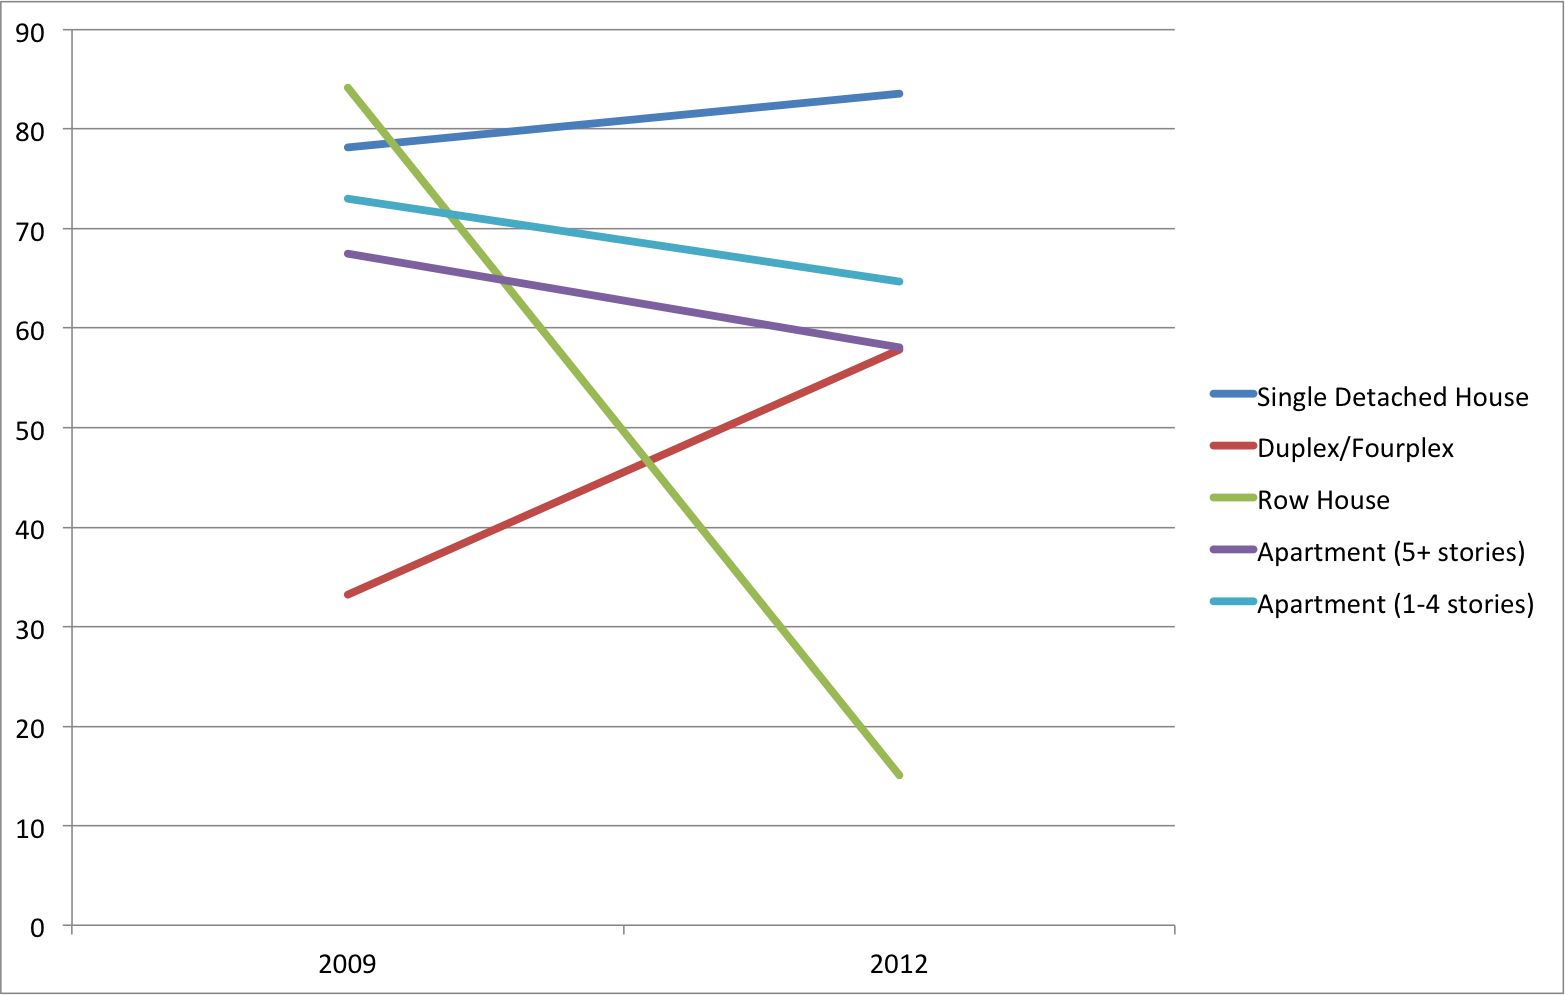
Figure 1: Riverdale ownership rates as a percent of total housing for a variety of housing types.
From 2009 - 2014 the total number of housing units increased from 940 to 965. The number of single detached houses increased by 14, row houses by 51, and apartment units by 18. Duplex/triplex/fourplex decreased by 58. These numbers seem to indicate that the land occupied 'plex' units were used to build single family homes and row/apartments.
While I have rental and owner data for 2009, 2012 and 2014, the rate of 'no response' for the 2014 data ranges from 23 - 28% for single-detached, 'plex',and apartments. Row houses stand at a 'no response' rate of 5%. I will, therefore, not consider the 2014 data.

Figure 2: Riverdale rental rates as a percent of total housing for a variety of housing types.
Between 2009 - 2012 ownership rates in Riverdale have decreased for most housing types (please see Figure 1), but most precipitously for row houses which saw an ownership decrease of just under 80% (from 84% in 2009 to 15% in 2012); apartments (1-4 stories and over 5) decreased by 9%. Ownership of single detached houses increased by just over 5%, and 'plex' ownership increased by 24%.
Rental rates for the same time period, 2009 - 2012 (Figure 2), decreased for single family homes (7%) and 'plex' buildings (24%). Rental rates increased for row houses by almost 70%, and by 7% for apartments (1-4 stores, and 5+).
Building Permits
The building permit data spans from 2009-2015 (see Figure 4: Summary Table of Riverdale Building Permit Data). The vast majority of build permits were issued for building new single family houses - 37 were demolished to 45 builds indicating that there were 8 new houses built on land not perviously occupied by a structure. The 45 builds represents 4.5% of the 965 residences in Riverdale, and cost almost $15 million to construct. Detached garages were big, with 47 detached garages being constructed valued at $342 000; most of these garages were built in conjunction with a new house. 11 new semi-detached houses were built costing a total of $4.7 million.
In contrast, the new 'lower value' dwellings - apartments, duplex's and row houses - were not constructed at all, and only showed a very modest number of interior or exterior alterations (see Figure 4).

Figure 4: Summary Table of Riverdale Building Permit Data. Although Decks and Garages have been pulled to show their value as a group, each deck and garage is associated with a house, and they are not stand alone buildings.
Demographics
From 2009 to 2014 the demographics of Riverdale have shifted. Specifically, there was increase in the number of men and women in the 60 to 80 year old cohorts (135 people), the 35 - 39 (19 people) year old cohort and 0 - 4 year old cohort (9 children). All other cohorts saw a decline for a total of 259 people. The 2009 census had a no response rate of just under 10%, while the 2014 census had a no response rate of close to 15%.

Figure 5: 2009 and 2014 demographic data for Riverdale. NOTE, the scale bars on the bottom of each graph are slightly off. From www.data.edmonton.ca.
Conclusions
In summary, ownership rates are down for all housing types except single family homes and 'plex' homes. Similarly, rental rates are up for all housing types, except 'plex' and single family homes. The most striking change is in row housing which saw a decrease in ownership by 80% and an increase in rental rates by 70%.
In addition, the vast majority of renovations, including new builds, were allocated to single family homes - 45 new single family homes, as compared to 0 new homes for all other housing types.
Finally, Riverdale is seeing a decline in all age groups except for 0-4. 35-39, and 60-80.
I think that there are a number of gaps in this data. Specifically, I would have liked to have seen time series of income data to see home family income has shifted and time series housing sales data, and school enrollment data for the Riverdale PS. I would also have liked to see a higher response rate for the 2014 census data. That said, I think I can draw some broad conclusions.
1. Middle aged people are being replaced by senior citizens, and those at the upper end of the child bearing years, and perhaps their young children.
2. The housing market is shifting from owning to renting, except for single family homes and duplex/fourplex, where ownership rates are up.
3. 4.5% of older single family houses are being replaced by new builds.
I think that Riverdale, while not being gentrified in a classical sense of having a primarily low income population be replaced by a higher income population, is seeing a shift based on money. I suggest that those who can afford to are buying the older and smaller houses, where a small portion (4.5%) of those single family homes are being rebuilt. I think the larger trend is for older people (the 60-80 demographic) to retire in Riverdale with it's close proximity to downtown and nestled within the river valley - close to trails and quiet. The smaller trend is for high income families to settle here with their young children.
Those who are younger, with no family or with an income of under 50K are renting the older apartments and row houses. I have no idea why the row house ownership plummeted.
What are your thoughts? What did I miss, or are you seeing an alternative story with these data? Please let me know.