There is an emerging narrative that characterizes Twitter as a tool of public engagement that can augment more traditional means of consulting with the public (for instance, see here for Environment Canada's commitment to "...implementing more avenues to facilitate online connections with partners, stakeholders and interested members of the Canadian public") . While there is no doubt that there are many many people who use Twitter (it is reported that there are over 200 million active Twitter accounts) as a mean of conversing with their elected officials, it is important to remember that Twitter does not include all voices within our Canadian cities. This blog post is an attempt to understand who might, in fact, be Tweeting within Toronto in a effort to understand who might be Tweeting about Toronto. About this map
[mapbox layers='mattdance.toronto_tweets' api='' options='' lat='43.65969596299056' lon='-79.38002295227051' z='15' width='600' height='400']
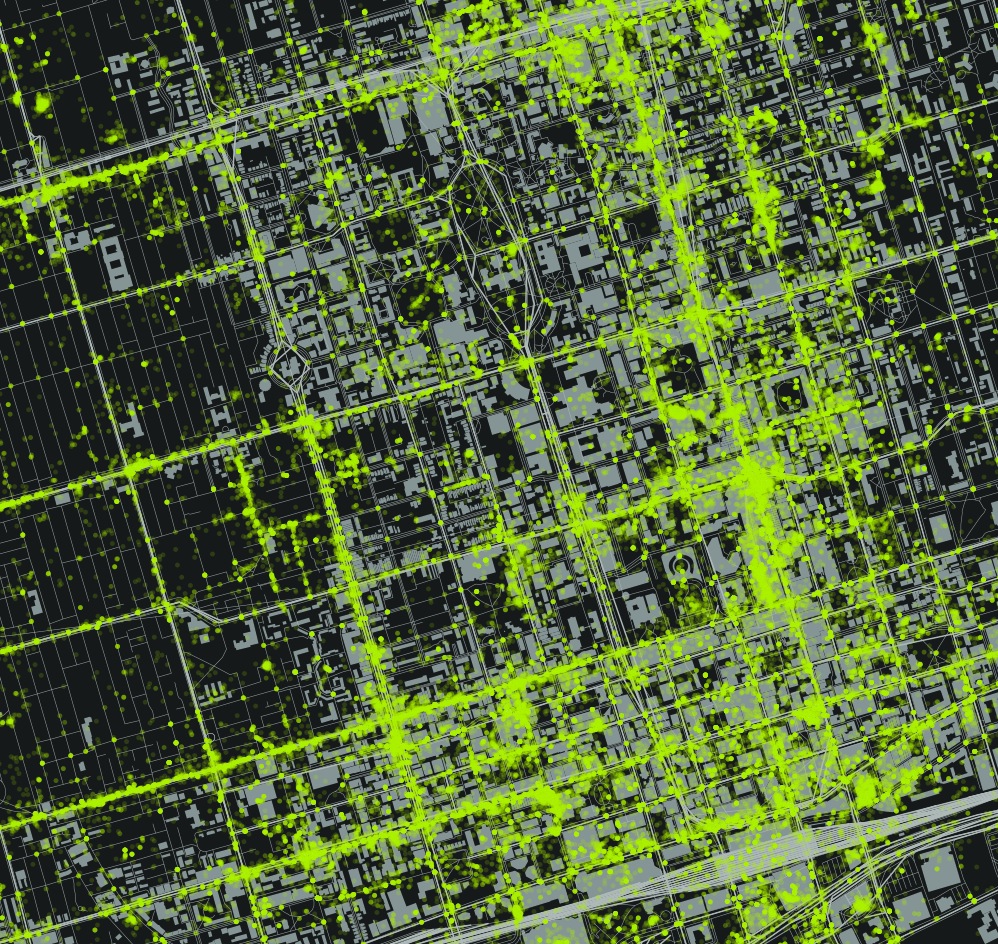
Above are Twitter maps of Toronto that represents all of the geolocated tweets for Toronto in 2011, about 1.5% of the total Tweets (in other words, 98.5% of Tweets are not location enabled). The Twitter data were provided by Trendsmap through John Barratt (thank you!). A full sized version of the dynamic map can be found on the Map Box site.
This was a challenging data to work with as it is so large. I started in QGIS to understand how the data looked and to pair it down to just tweets within the GTA. I moved the data into Tile Mill by Map Box, and layered Open Street Map data to provide visual context for the tweets. The 'heat map' effect that I used is described here, as I was not able to make the QGIS heat map plugin work, for some reason (please let me know if you can help with this). I plan on learning how to build a PostGIS database on my computer so that I can do this.
The idea for the map and post came from these three beautiful and interactive twitter maps: (1) London, (2) New York and, (3) Melbourne.
Observations and analysis
A closer look at the map reveals very dense Twitter areas and areas that are very sparsly Tweeted. The most densely Tweeted area is bounded by Bloor Street to the North and Lake Ontario to the South, connected by Young Street. There is a greater density along the Lake, away from Young to the West. There are also a small number of ghost Tweets on the lake North of Toronto Island.
These boundaries are visible in the above image. There are also a couple of identifiable hot spots - the Eaton Center, Rogers Center (cut off in the above picture). The areas described by this Twitter Density also corresponds with the tourist and suburban destinations - the areas around Young - Bloor - and Front Street, including the sports stadiums, are not just neighbourhood destinations, but destinations for those interested in shopping or taking in the sights in Toronto.
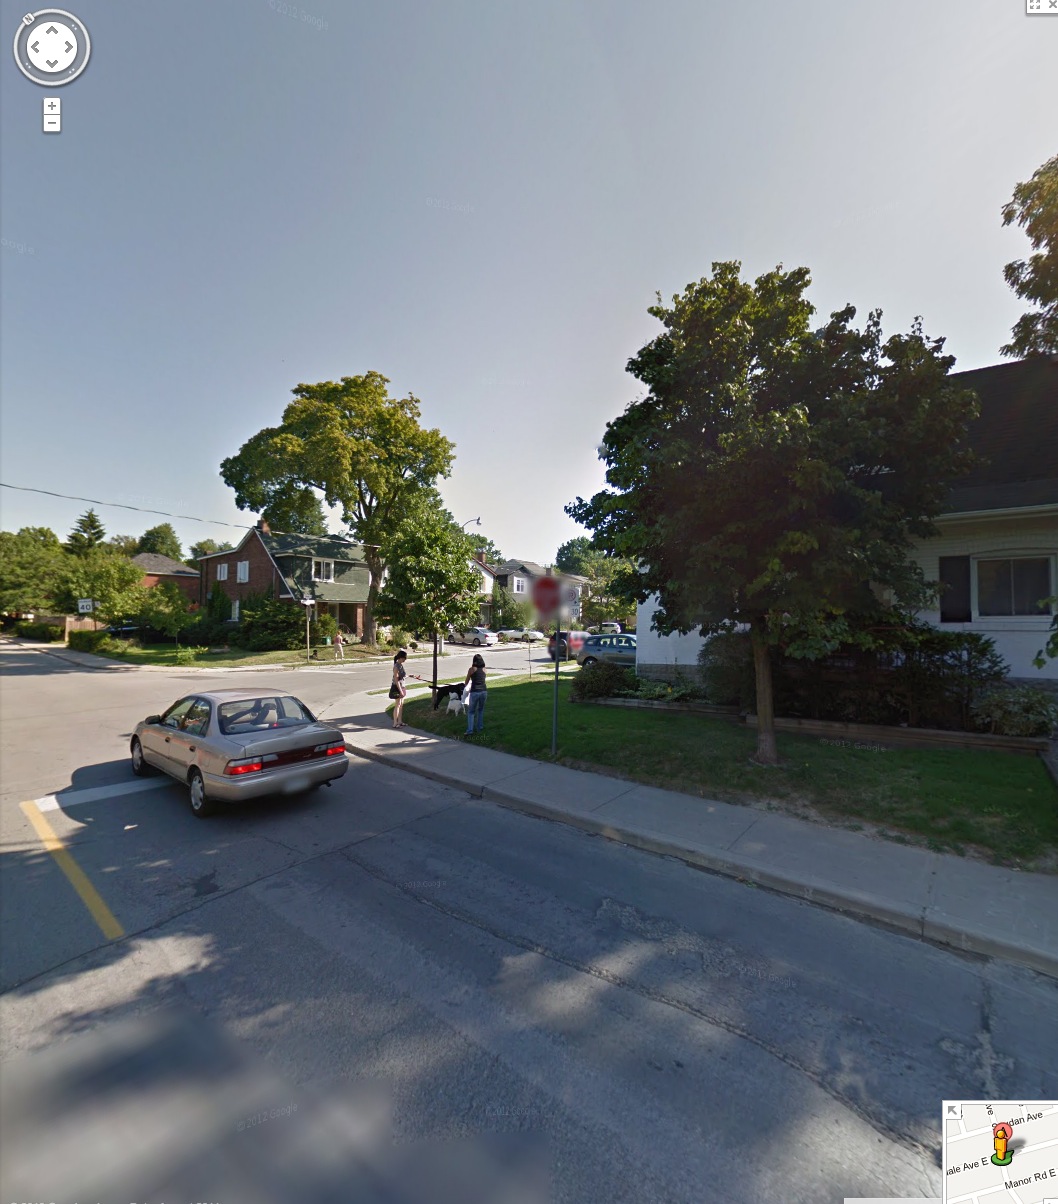
In contrast, those areas that are strictly neighbourhoods, such as Hillsdale Avenue (running east from Young) do not offer that same density.
The above example shows a middle class neighbourhood within Toronto that does not have a large number of Tweets other than the cluster at the corner of Young Street and Eglington Avenue in the top left of the image. The Mt Pleasant Cemetery bounds the neighbourhood to the South.
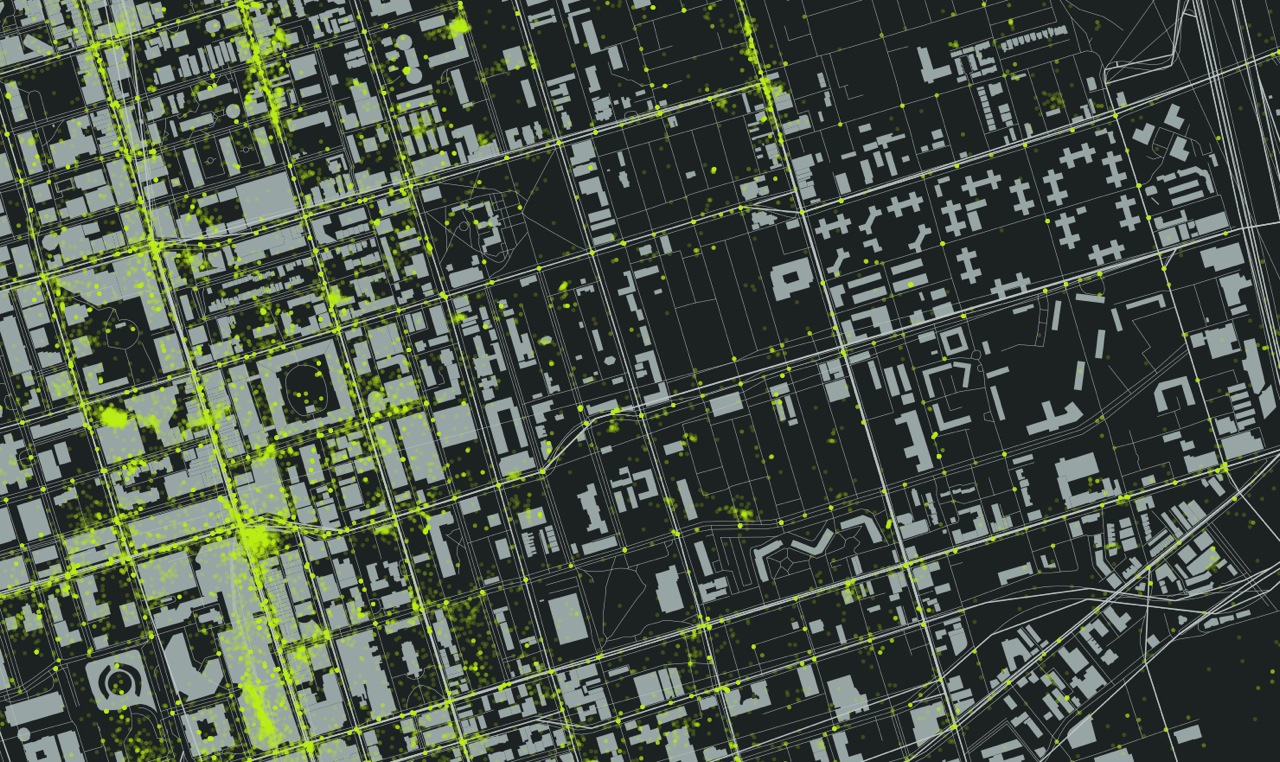
In addition, poorer neighbourhoods also seem to have a dearth of tweets. The following image is of the Regent Park area between Dundas and Gerrard.
It is clear from the image that many people are Tweeting on Young Street. You can even see a hotspot in the Eaton's Center and at the south east corner of Young and Dundas. Further east, nothing. From the Regent Park Wikipedia page:
The average income for Regent Park residents is approximately half the average for other Torontonians. A majority of families in Regent Park are classified as low-income, with 68% of the population living below Statistics Canada's Low-Income Cut-Off Rate in one of its census tracts, and 76% in the other (compared to a Toronto-wide average of just over 20%).
Conclusions
I suspect that most of the Tweets that occur in Toronto are from those who live in the region, but who may be downtown for some shopping, to take in a game, or other recreation. I also suspect that a majority of those who live in Toronto are a small portion of the overall Tweets in the area between the Lake and Bloor, adjacent to Young.
As you move from this area, I suspect that a greater portion of Tweets are made by residents of those neighbourhoods, simply because fewer 'tourists' would travel to these neighbourhoods unless there was an attraction, such as shopping or food. Although I am only exploring those ~1.5% of tweets that are geolocated, I feel that these are the Twitter users who are most likely to engage with an Open311type of application, to use their smart phones as a means of communicating location details to their municipality. If this is the case, then those poor areas of the city, potentially the most disenfranchised, will become more so (look at Mark Graham's work mapping the digital divide in Francophone Africa).


