The Government of Alberta's open data portal contains Alberta Eco Zone data. I made a map with it:
Open Data
In The News
I was recently asked to make some maps with data from the Government of Alberta's new Open Data Portal. Here is a video clip that made the local CTV News. A blog post that addresses my experience making the maps and my concerns regarding the portal can be found here. During an open data discussion with various stakeholders and Minister Clement, I said that an effective open data portal is one which causes discomfort for the government hosting it. I don't feel that this GOA data portal is at all challenging as there are no difficult datasets to be found. For instance, there was a recent slurry pond leak from a coal mine near Obed AB that leaked 'toxins' into the Athabasca River. The data associated with that release, which clearly makes the Government of Alberta uncomfortable judging by their media, should be on their open data portal. Sadly, the video has not sound. Working to fix this.
ctv_interview from Matthew Dance on Vimeo.
Air Quality Egg: Up and Running
My egg is now up and running! I was able to easily figure out the instructions for connecting the AQE to my computer and applying a software fix to the AQE. The Vimeos for the fix can be found here. There are three components to the AQE that I really like:
- It's open sourced;
- The data streams are easily accessible in various formats;
- A Dashboard to access your data, and the data of those whom you follow.
Open Sourced Air Quality Monitoring
The above schematic is but one example of how the AQE people endeavor to make the framework for the egg as open as possible. Granted, it is an elite person who could go out and build one from scratch, but having everything that goes into the egg available on-line means that individuals can carve off a little section of the project that they can personally improve, and make it better. Perhaps you are not a hardware person, then you can build the software, or perhaps you want to establish a AQE community in your city, or maybe you want to shell out you 185$ to simply monitor the air outside your home. Whatever fits your mood.
Data is available
Granted, this is similar to Cosm's open hard- and soft-ware approach, but it is worth noting based on how accessible the data is. As a novice data user, I appreciate that they support basic graph making within their platform, and provide tools to embed your graph into a blog post, Facebook, or on Twitter.
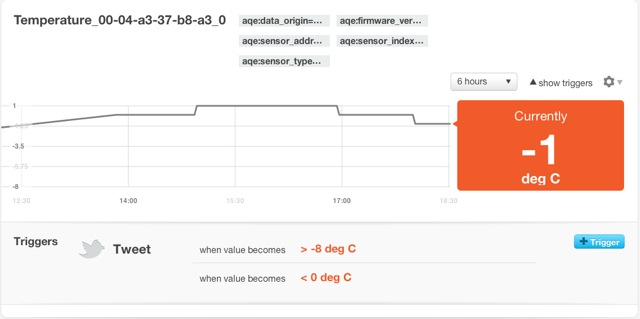
'Triggers' can also be created. A trigger is defines a set of criteria for the data to meet, and if those criterium are met, then a tweet is sent out via your account alerting you, and the world, to the pertinent information. From the image above, an alert will be sent out when the temperature is >-8C or <0C. A user friendly tool that alters you to user defined changes in the data stream.
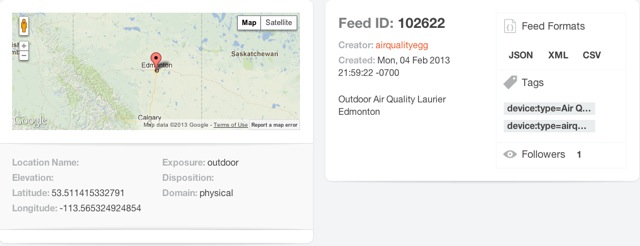
The data is also accessible via JSON, XML and CSV. While I am not capable of creating a data feed through JSON into, for instance, Excel, the feeds are available for those who are. I will, though, access the CSV function and compare the AQE feed with Alberta Environments NO2 feed for the City Center monitoring site. Coordinates for the AQE, Feed ID, and other information are provided clear and obvious.
Dashboard or 'Console'
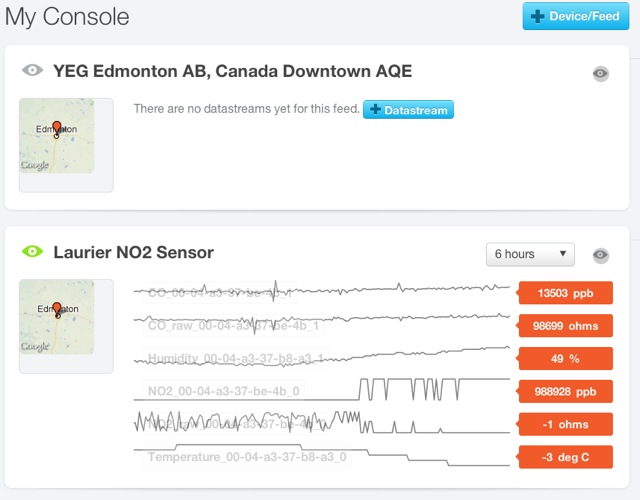
Finally, Cosm has provided a console interface to allow the user control over the data feeds that they follow, including API keys for each feed, and the ability to create apps. I have not yet explored the app feature to any extent, but I will report back when I do!
Finally, you can access and review the NO2, CO, Temperature and Humidity data that I am collecting from here.
Where do accidents happen?
There is currently some debate in Edmonton regarding bike lanes, and the inconvenience that they will provide to drivers. In particular, Mayor Mandel was quoted as saying:
Not that they’re not a good idea, but it just seems someone behind your scenes out there has just decided we’re going to eliminate all vehicles and only have bikes.
In response, I wanted to look at the number of interactions that cars have with bike or pedestrian in Edmonton. The data.edmonton.ca portal had the appropriate data from 2010 - intersection collisions here, and midblock collisions here. I sorted the data for pedestrian and bicycle collisions with vehicles, and I included all data for bikes and pedestrians, regardless of who was deemed to be a fault. I loaded the CSV data into Cartographica, a lightweight Mac based desktop GIS, and used OpenStreetMap as the base layer for Edmonton. The results are below, captured as an image (I will work with someone more capable that me to check the data and to get it on line in an interactive format). Legend: red/yellow diamonds are intersection collisions, blue/blue diamonds are midblock collisions. The numer adjacent to each diamond represents an aggregate of pedestrian/bicycle interactions with motor vehicles. .
Some things to note:
- More collisions happen at intersections (90 in total) than midblock (22 in total).
- The most dangerous intersection in 2010 was Fort Road and 66 Street, with 4 collisions.
- The most dangerous stretches of road were Gateway BLVD north of 51 Ave, 109 Street north of Whyte, and Calgary Trail north of 34th Ave.
- Midblock collisions saw 18 pedestrians and 4 cyclists injured.
- Intersections saw 65 pedestrians and 27 cyclists injured.
Conclusions
There is a greater safety issue at intersections where advanced pedestrian and cyclist activated lights should be installed in conjunction with bike lanes. Furthermore, if the bike lanes are being considered for safety reasons, residential street speeds should be lowered from 50 km/hr to 30 km/hr. There is convincing data that cars travelling slower inflict less damage than tose travelling faster - see this WHO report [PDF].
Finally, if the City of Edmonton were serious here, they could conduct an interesting study to track accident rates with cyclists and pedestrians give the introduction of bike lanes, intersection controls and low residential speed limits.
AQ Egg: First impressions
 My Kickstarter contribution has finally paid off! My Air Quality Egg has arrived in the mail! To recap, the AQ Egg over-reached its funding goal in April 2012. The project had asked for $39 000.00, and raised over $144 000.00 with 927 backers. Impressive. And scary. As we soon learned, their were high expectation, and the egg almost hatched as vapour-ware (an impressive timeline can be found here). In short, what was promised in July 2012, was shipped in January 2013. What shipped, sadly, is not what I had expected.
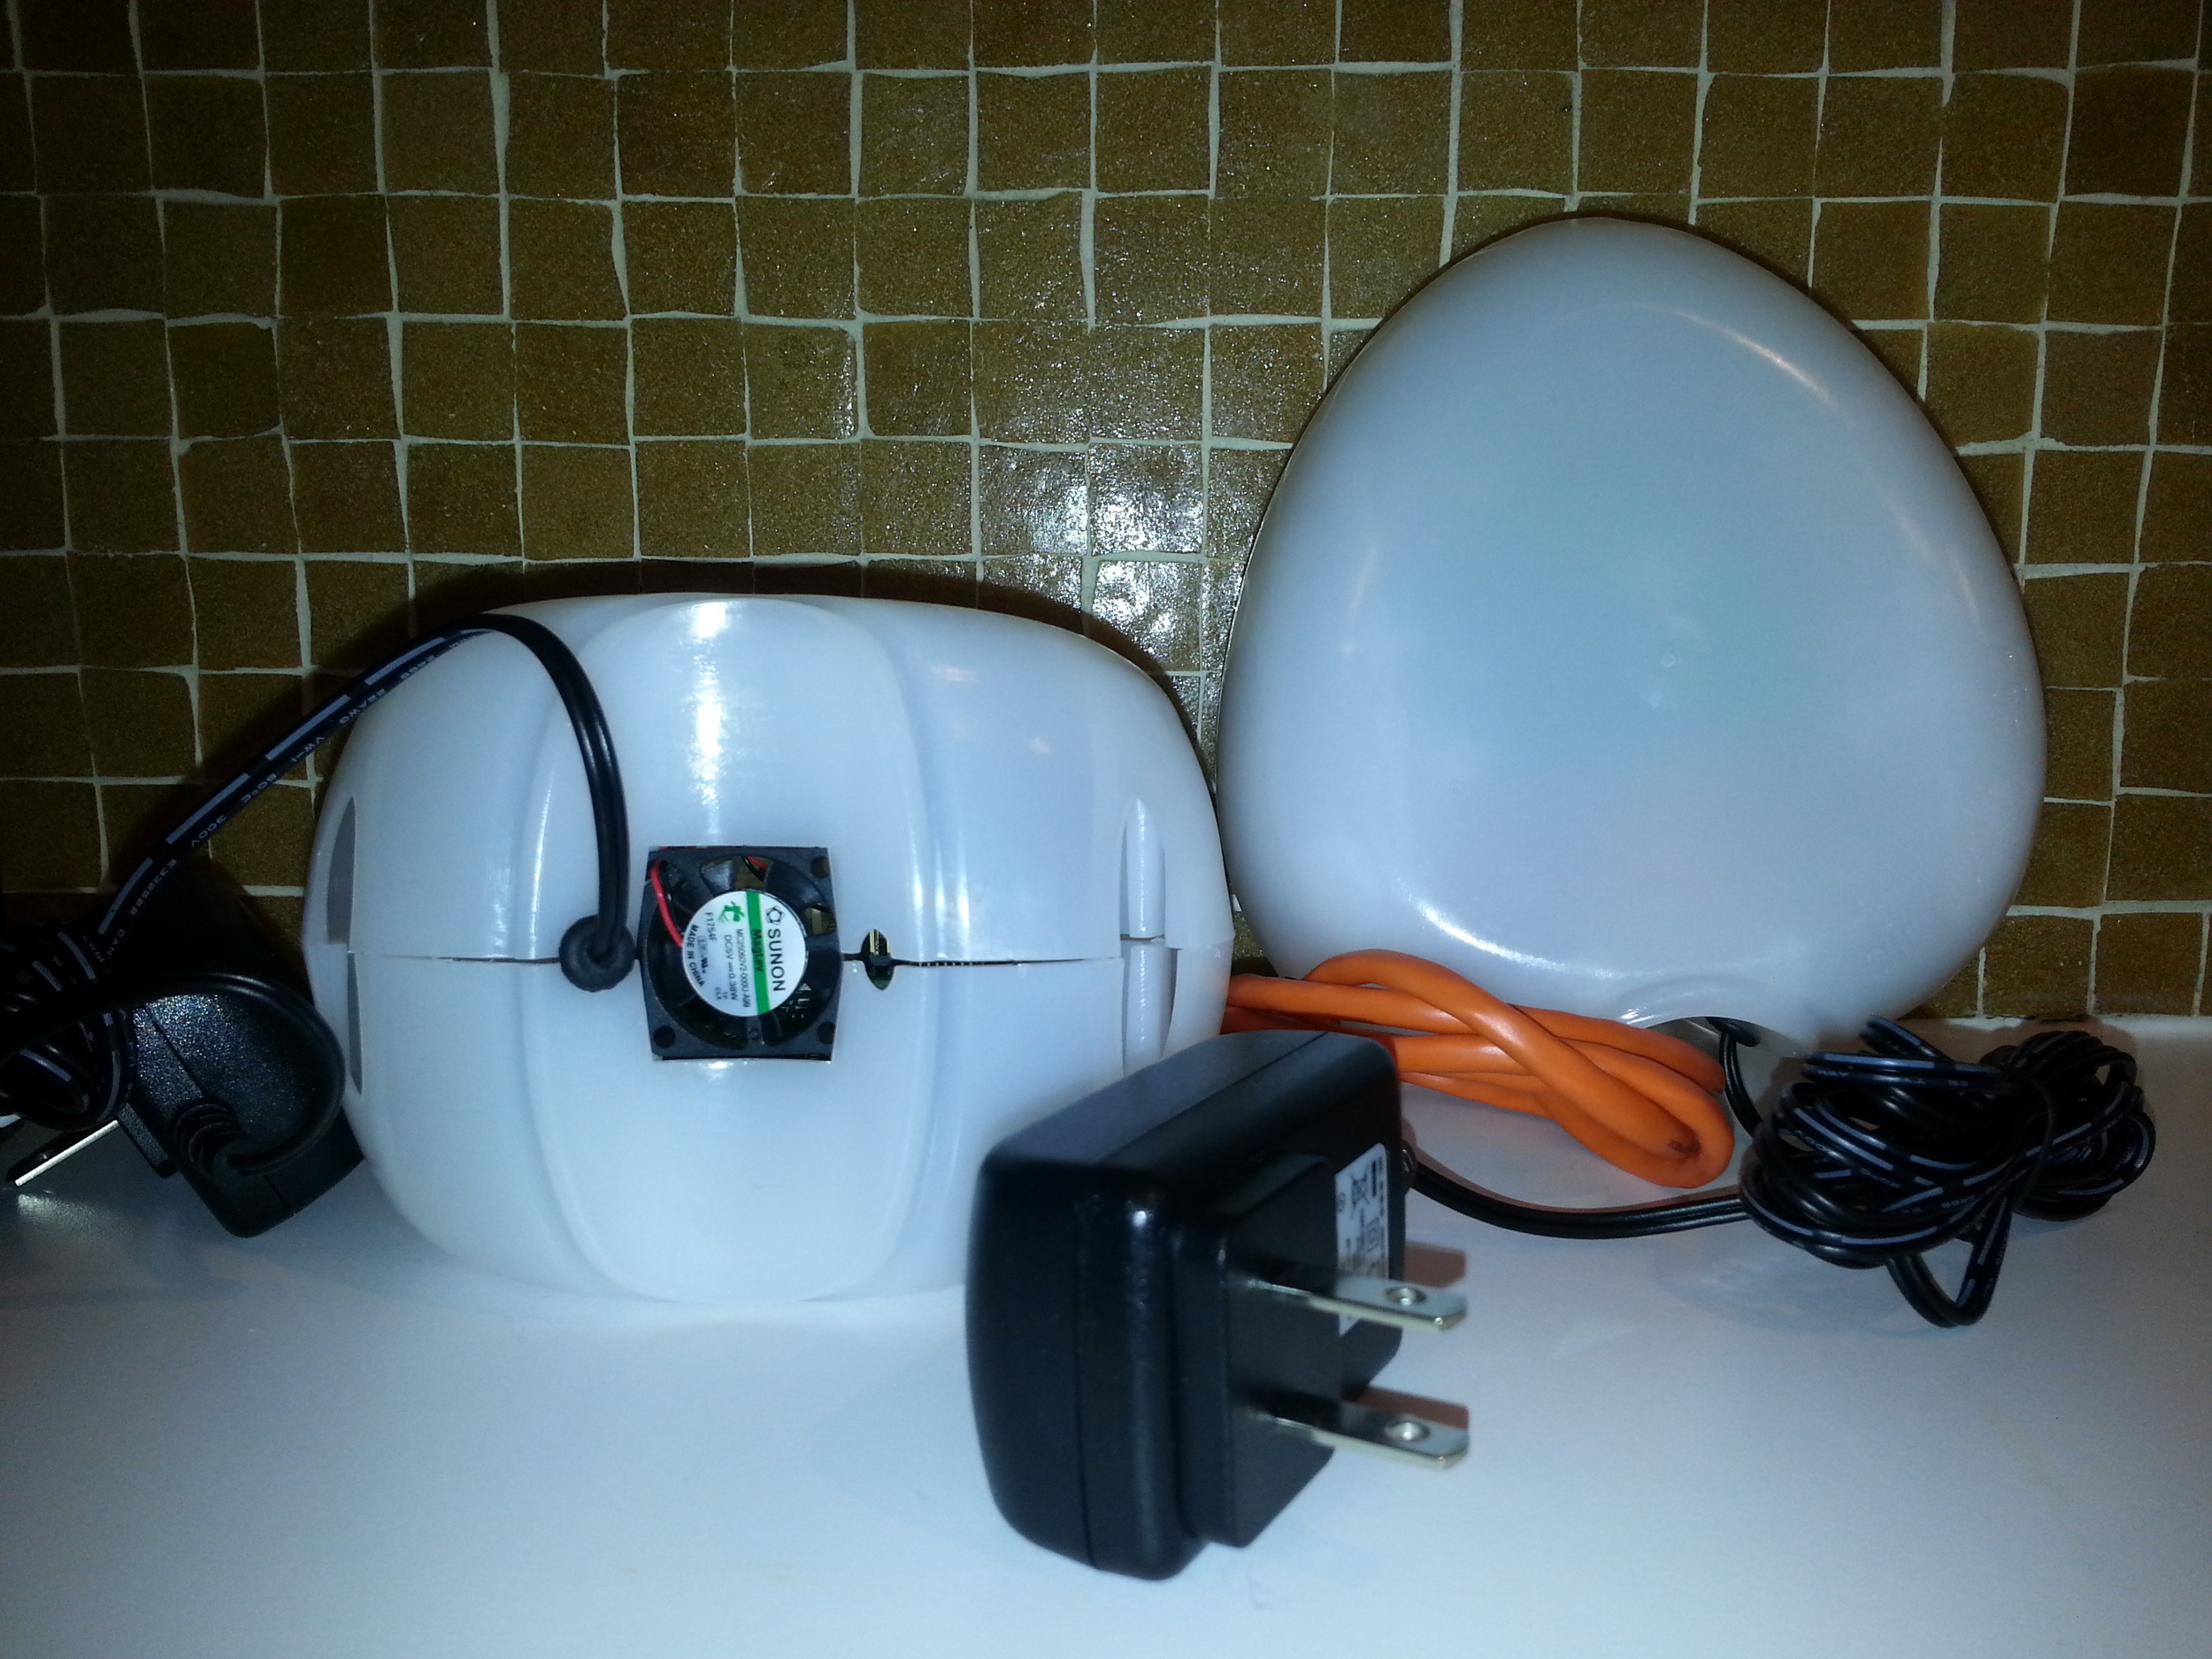
Given the extra time that was used to create the egg, I was disappointed at how 'cheap' and flimsy it felt. In removing it from the shipping box, the sensor pictured at the base of the left egg became loose and fell out. The egg, which is 'snapped' together via a vertical seam that runs around the device, was not properly 'snapped'. It was loose and I was able to easily pull the shell apart. Furthermore, when reading the directions on how to set the sensor up, I was surprised to learn that they shipped some of the eggs, and unknown numer of them, with a software bug (the details here).
Needless to say, these are annoying details.
But, I am still a fan. While the NO2 sensor is not sensitive enough to pick up all but the highest spikes in NO2 (that we know as no one has consistently monitored busy roadways in Edmonton), it feels cheap, and it arrived months late, it still represents a remarkable revolution. No other AQ sensor offers such easy and inexpensive citizen access to AQ monitoring. Granted, you have to be rich and technically literate to deploy one of these things, but it is a step away from government controlled monitoring. It is possible to build or purchase at a low cost, and it is complete open sourced. In other words, you can download a component list, 3D printing schematics, and the code to build and launch your own sensor. I have to remember that I received a V.1, and as with many V.1, there are issues. But these issues will get ironed out in successive iterations as more people look at, and improve upon, the egg.
You can learn more about the Air Quality Egg here , and you can view my (empty for now) data stream here. I'll update this when I have my egg feeding data to the web.
Towards Data Driven Urbanism
We’re a city of nearly 800,000 people, and we’re basing the public involvement part of the decision on 80 comment forms and 15 interviews? I truly believe more people want to provide feedback, it’s just too difficult to do so at the moment. Mack Male, in a blog on Public Involvement.
A recent blog post in the Charette.ca discussed the idea of DYI Revitalisation, where a bunch of citizens, business owners and associations get together to host evens such as the 104 Street Block Party. There are several benefits that arise from closing down a few blocks of a downtown street that include building a sense of community, connecting citizens with the local business, artests, musicians, each other. While the 104 Street Block Party is an awesome event that highlights what a place can be, it is a shallow way to engage citizens in a meaningful discussion of urban planning and development. In my view there are four practical "levels" that citizens can be engaged on: (1) a Charette where citizens attend municipally sponsored meets that address specific issues such as the Walter Dale Bridge Project, or the Arena; (2) DYI Revitalisation such as the 104 Street Block Party; (3) Tactical Urbanism, and ;(4) Data Driven Urbanism. We need all four to successfully engage citizens and municipalities, but we are currently operating at the first and second levels.
Tactical Urbanism (TU) is much like open source software development which seeks to produce consistent but incremental change over time. This requires frequent releases involving input from all who are interested in specific local projects. TU is implemented in an urban environment through experimentation (i.e. a single $500 bench rather than $10000 worth of benches) that supports (requires) feedback from citizens. Citizens are also empowered to claim their own space with paint and small infrastructure improvements (putting in a local bike lane, speed bump). The goal is to get people involved with the local through "a deliberate and sometimes experimental phased approach to instigating change. The result is the development of desirable locations and social capital between citizens, local government and businesses."
Data Driven Urbanism (DU) recognizes that the world of citizen engagement is changing with mobile devises proliferating our urban fabric even as the GeoWeb develops as a platform that enables crowdsourced mapping. DU recognizes that truly participatory planning must go beyond drawing on flip charts and maps and requires a plethora of open data sets, a platform of engagement and building long term relationships with developers and engaged citizens. What would it look like if we could GeoTweet a downed tree in a river valley path such that the River Valley Rangers received it; that these tweets were mapped? Now imagine if we could use the tools in our pockets - iPhones, BlackBerries and all other GPS, camera and connected mobile devises to provide feedback to our Municipality on what works and what does not. While there are privacy and behaviour concerns, these concerns are navigable and can be addressed.
The gap, as I see it, is a City wide strategy to address public involvement using new technologies and approaches. As great as the IT department is (and they are great!), they are too few to enact widespread change within the City of Edmonton bureaucracy. Immediate improvements that could be made tomorrow include higher standards for developers. For instance, why are they not required to produce 3D files for Google Earth that would allow citizens to engage with a developers vision? Why are public consultations limited to old style Charette, surveys and questionnaires? It is possible and desirable to engage with citizens via an on-line map that supports geo-located comments, wikis or discussion forums.
Within geography it is commonly understood that people are experts of their local environment. Lets engage with all who would have something to say about their locality via different and varied channels that include face-to-face meetings in addition to web-based consultations. The combined technologies of smart phones and the web as a consultation platform would offer a data driven approach to urbanism that might provide insight into what makes a location a place.
Urban GeoWeb 1
This is an inaugural post, the first of a series that will explore the intersection of the Urban with the GeoWeb and Social Computing. My interest is specific to data visualisation, collaboration and access to resources that will enrich citizens experience living and working in urban environments. The GeoWeb is emerging (has emerged?) as a dominant platform by which people consume, generate and communicate spatially relevant information that is a reflection of their use and experience interacting with urban areas. Social Computing is that cloud of information and people / groups that surrounds us all, and that we access via a mobile devise or computer.
Transit is an obvious way to incorporate several data streams - open transit data which describes the bus schedule and bus stop locations, potentially GPS from individual buses - all displayed on an interactive map interface that supports queries. This is standard. Mapnificent is not standard as it displays all of the Google enabled transit maps in the world, and provide the user travel times. TripTropNYC creates a travel time heat map from any location of New York. Boston's Street Bump app utilises a smart phone's GPS and accelerometer to provide a realtime view of the state of Boston's roads. I love this this type of application development is seeking to crowdsource, through citizen based sensors, less expensive ways to track urban infrastructure.
Sustainable Cities Collective expands on this theme by discussing WikiCity as a way to engage citizens in city improvement:
Local groups all around the world are taking the initiative and are building the infrastructure that governments refuse or are slow to do.
Charlie Williams, an UK based artist, has created some very cool looking Air Boxes which provide realtime feedback to citizens on the quality of their air. These boxes sit at street level and simply shows a red, orange, or green graphic depending on the quality of the air.
Finally, the MIT Sensable City Lab hosted a Future Cities forum that brought together a number of leading thinkers, including Carlo Ratti the Lab's director, to discuss future cities. The video of these talks can be found here.
I'll close with these words from the Future Cites website:
Over the next few decades, the world is preparing to build more urban fabric than has been built by humanity ever before. At the same time, new technologies are disrupting the traditional principles of city making and urban living. This new condition necessitates the creation of innovative partnerships between government, academia, and industry to meet tomorrow's challenges including higher sustainability, better use of resources and infrastructure, and improved equity and quality of life.
Alberta's Expert Monitoring Panel
Last week I responded to an open call by Alberta's Expert Monitoring Panel to present my take on the following questions:
1. What should a world class environmental monitoring system look like? 2. What type of organization should manage and operate the proposed environmental monitoring evaluation and reporting system? 3. What kind of information should the environmental monitoring system produce? 4. How should the environmental monitoring system be funded? 5. Do you have any further suggestions or advice to help the Panel as they develop recommendations for a world-class environmental monitoring system?
As I didn't feel that I could adequately address each question, my presentation and argument focuses on components of Q1 and Q2. This blog post will focus on the Open Data aspects of Q2. My full presentation can be found here: Presentation to Alberta Environment Expert Panel on AAQM.
Slide #5 outlines the 3 Laws of Open Data as proposed by David Eaves, Slide #6 outlines the process of turing open data into a community good. Open Data is important in this context as it has the potential to engage a broader base of citizens in a conversation that is normally limited and closed. While engagement is possible it does not happen quickly or easily. If there was a formal process for turning open data into community engagement, it might like this:
Step One: Create An Open Data Catalogue
This open data catalogue should be indexed such that it can be found and formatted such that the data is readable by a computer. The data should also be supported by a generous licensing agreement that demonstrates trust in the community. Keep in mind that the data should be good and complete, but not perfect. If there are issues, the community that you build will find them and tell you.
Step Two: Engage a Community of Developers
There are a number of things that need to happen here: (1) create and Application Programming Interface (API) as an invitation for developers to access and use the data; (2) advertise that the data exists, and where it is; (3) link the core data with other support data, for instance a description of what the substances are, any location information and other meta data; (4) finally create an event or competition as a means of engaging developers. Something like and Apps for Air contest, coupled with a hack-a-thon.
Step Three: Get the Apps Out There
There are groups of smart phone and web users who love new toys. Ensure that these folks know that some cool Air Quality Applications are being developed, and invite these early adopters (and researchers) to use the apps and to provide feedback on them. Perhaps they can even vote on the winning application. In this instance, it is important to engage the early adopters through the smart use of social media tools such as Facebook and Twitter. Create a FB page, start using a Twitter hashtag, ask key members of the community for advise and help in getting the word out. Engage and don't be afriad.
Step Four: Wider Acceptance
As the apps start making their way onto the web and possible mobile devises, more people will use them and, hopefully, two things will happen over time. Citizens will realize that they have access to cool and useful tools, and the government will slowly become more comfortable with greater openness and transparency.
Conclusion
I was asked by the expert panel about brand protection. I believe that the best strategy to protect one's own brand is to engage with a community of people who support your goals and activities. That engagement is the best brand protection available. It is unfortunate that, to date, the Government of Alberta is too busy yelling things that we don't believe. More listening, engagement, and trust is required.


