Air

Air Quality Egg: It's all about the data. Part One

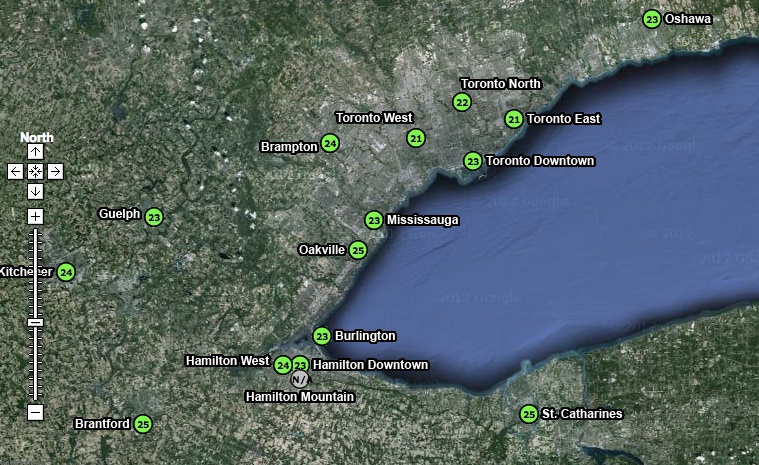
For many reasons the Air Quality Egg represents a profound shift from the current regiem of regulator controlled Air Quality monitoring   Specifically, the current model of AQ monitoring sees a regulator (government) define the AQ issue, the substances of concern, and the monitoring response to these top-down defined concerns.  The AQEgg turns this model on its head by allowing, though citizen lead (though still early adopter) monitoring technology that is accessible to those who can afford a $185 sensor, or have the knowhow to build their own via 3D printers and electronic schematics. In other words, the model shift from top down to bottom up where a citizen, or group of citizens, can define where monitoring should occur. As detailed in this post, the current AQ monitoring network focuses on a regional level of air quality.  For instance, there are three sensors in Edmonton that provide a regional overview of the air quality through a metric called the Air Quality Health Indicator.  Southern and Western Ontario have a total of 15 stations (see map below) that provide air quality data for over 6 million people.

ON_airmonitoring_map

The AQ Egg provides three distinct advantages:

  1. They can be located at street level more easily. We really have no idea what is happening on street level and that the numbers may be well above what the regional AQ network reports.;
  2. The map provided my COSOM is more interactive and open. In fact, developers have already started developing products in support of the AQEgg. See the Air Quality Egg Helper Chrome extension;
  3. The AQ Egg data are open and available for download and analysis.  This open data philosophy is not consistent across all regulators.

The one big advantage of regulator monitoring is the quality of the sensor, and thus the data where the measure of a sensor is the quality of the data it provides. As stated on the AQEgg wiki "...more work is really needed to make the low cost sensors sensitive to ambient pollutant concentrations." This can be seen in the sensitivity of the NO2 sensor as compared to actual ambient concentrations. In Vancouver, for instance (from the 2011 Lower Fraser Valley Air Quality Monitoring Report [PDF], pp. S-9) the annual average NO2 goal for Vancouver is 40 ug/m3 or less, with the one hour range being up to 122 ug/m3. The range of the NO2 sensor is 94 - 9400 ug/m3, less sensitive than the 'normal' ambient concentrations as detected by the regulator sensor.

Furthermore, the quality of the data is confounded by cold (an issue where I am from in Edmonton), and humidity. Regulator sensors heat or cool the air feed to a standard temperature and strip out any humidity to create a 'clean' sample.

My next post, hopefully coming soon, will examine some of the initial data generated by the AQEggs as compared to the regulator data.

Air Quality Egg: Up and Running

My egg is now up and running!  I was able to easily figure out the instructions for connecting the AQE to my computer and applying a software fix to the AQE.  The Vimeos for the fix can be found here. There are three components to the AQE that I really like:

  1. It's open sourced;
  2. The data streams are easily accessible in various formats;
  3. A Dashboard to access your data, and the data of those whom you follow.

Open Sourced Air Quality Monitoring

schematic

The above schematic is but one example of how the AQE people endeavor to make the framework for the egg as open as possible. Granted, it is an elite person who could go out and build one from scratch, but having everything that goes into the egg available on-line means that individuals can carve off a little section of the project that they can personally improve, and make it better. Perhaps you are not a hardware person, then you can build the software, or perhaps you want to establish a AQE community in your city, or maybe you want to shell out you 185$ to simply monitor the air outside your home. Whatever fits your mood.

Data is available

Granted, this is similar to Cosm's open hard- and soft-ware approach, but it is worth noting based on how accessible the data is.  As a novice data user, I appreciate that they support basic graph making within their platform, and provide tools to embed your graph into a blog post, Facebook, or on Twitter.

graph

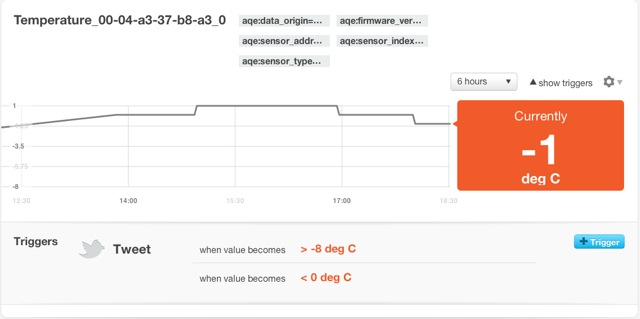
'Triggers' can also be created. A trigger is defines a set of criteria for the data to meet, and if those criterium are met, then a tweet is sent out via your account alerting you, and the world, to the pertinent information.  From the image above, an alert will be sent out when the temperature is >-8C or <0C.  A user friendly tool that alters you to user defined changes in the data stream.

Location

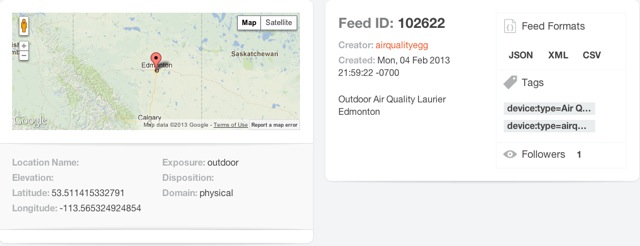
The data is also accessible via JSON, XML and CSV. While I am not capable of creating a data feed through JSON into, for instance, Excel, the feeds are available for those who are.  I will, though, access the CSV function and compare the AQE feed with Alberta Environments NO2 feed for the City Center monitoring site. Coordinates for the AQE, Feed ID, and other information are provided clear and obvious.

myconsole

Dashboard or 'Console'

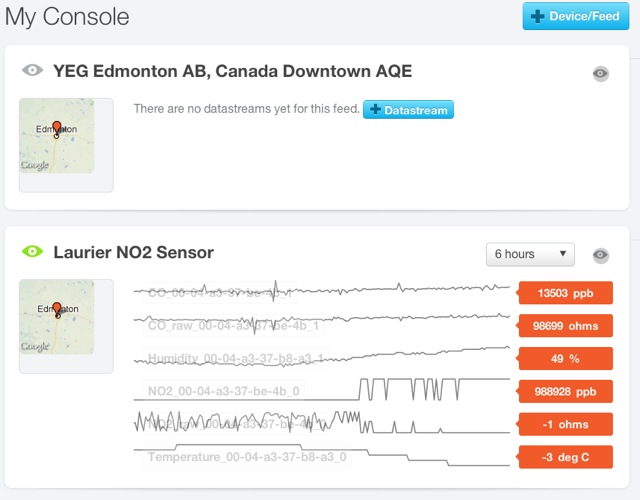
Finally, Cosm has provided a console interface to allow the user control over the data feeds that they follow, including API keys for each feed, and the ability to create apps.  I have not yet explored the app feature to any extent, but I will report back when I do!

Finally, you can access and review the NO2, CO, Temperature and Humidity data that I am collecting from here.


AQ Egg: First impressions

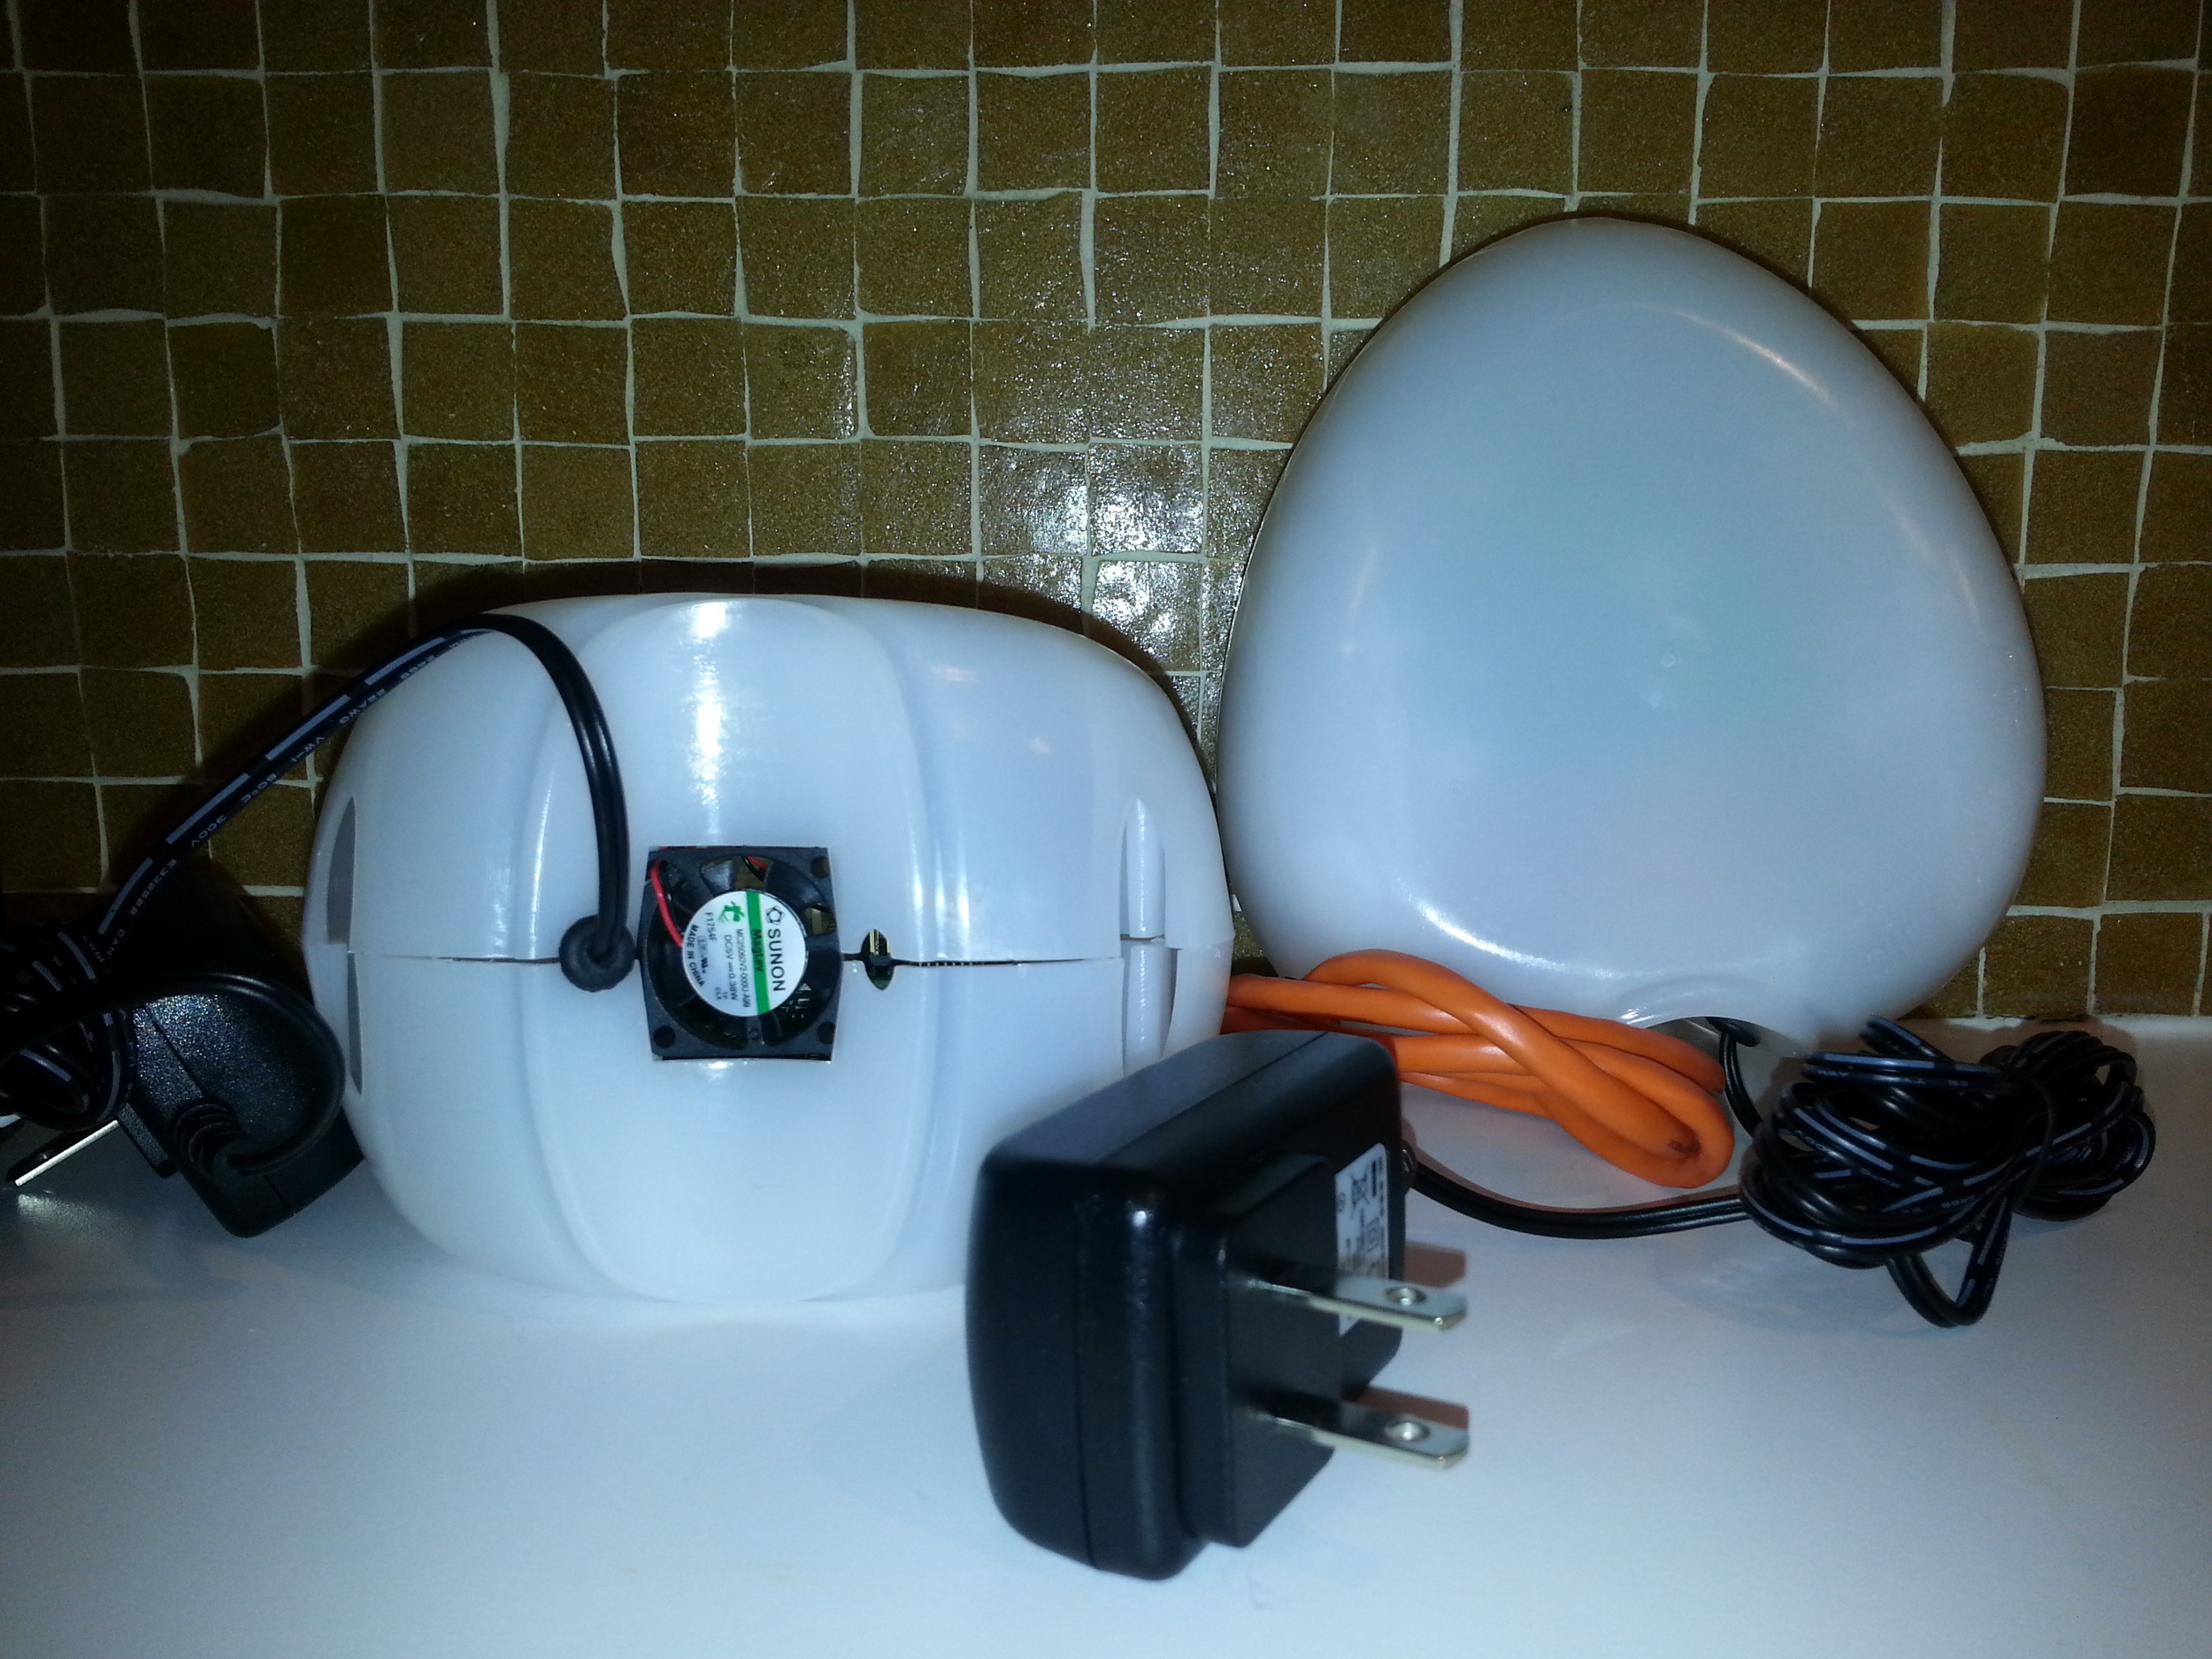
Air Quality EggMy Kickstarter contribution has finally paid off!  My Air Quality Egg has arrived in the mail!  To recap, the AQ Egg over-reached its funding goal in April 2012.  The project had asked for $39 000.00, and raised over $144 000.00 with 927 backers.  Impressive.  And scary.  As we soon learned, their were high expectation, and the egg almost hatched as vapour-ware (an impressive timeline can be found here). In short, what was promised in July 2012, was shipped in January 2013.  What shipped, sadly, is not what I had expected. Given the extra time that was used to create the egg, I was disappointed at how 'cheap' and flimsy it felt. In removing it from the shipping box, the sensor pictured at the base of the left egg became loose and fell out.  The egg, which is 'snapped' together via a vertical seam that runs around the device, was not properly 'snapped'. It was loose and I was able to easily pull the shell apart.  Furthermore, when reading the directions on how to set the sensor up, I was surprised to learn that they shipped some of the eggs, and unknown numer of them, with a software bug (the details here).

Needless to say, these are annoying details.

But, I am still a fan.  While the NO2 sensor is not sensitive enough to pick up all but the highest spikes in NO2 (that we know as no one has consistently monitored busy roadways in Edmonton), it feels cheap, and it arrived months late, it still represents a remarkable revolution.  No other AQ sensor offers such easy and inexpensive citizen access to AQ monitoring. Granted, you have to be rich and technically literate to deploy one of these things, but it is a step away from government controlled monitoring. It is possible to build or purchase at a low cost, and it is complete open sourced.  In other words, you can download a component list, 3D printing schematics, and the code to build and launch your own sensor. I have to remember that I received a V.1, and as with many V.1, there are issues. But these issues will get ironed out in successive iterations as more people look at, and improve upon, the egg.

You can learn more about the Air Quality Egg here , and you can view my (empty for now) data stream here. I'll update this when I have my egg feeding data to the web.

Alberta's Expert Monitoring Panel

Last week I responded to an open call by Alberta's Expert Monitoring Panel to present my take on the following questions:

1. What should a world class environmental monitoring system look like? 2. What type of organization should manage and operate the proposed environmental monitoring evaluation and reporting system? 3. What kind of information should the environmental monitoring system produce? 4. How should the environmental monitoring system be funded? 5. Do you have any further suggestions or advice to help the Panel as they develop recommendations for a world-class environmental monitoring system?

As I didn't feel that I could adequately address each question, my presentation and argument focuses on components of Q1 and Q2.  This blog post will focus on the Open Data aspects of Q2.  My full presentation can be found here: Presentation to Alberta Environment Expert Panel on AAQM.

Slide #5 outlines the 3 Laws of Open Data as proposed by David Eaves, Slide #6 outlines the process of turing open data into a community good.  Open Data is important in this context as it has the potential to engage a broader base of citizens in a conversation that is normally limited and closed.  While engagement is possible it does not happen quickly or easily.  If there was a formal process for turning open data into community engagement, it might like this:

Step One: Create An Open Data Catalogue

This open data catalogue should be indexed such that it can be found and formatted such that the data is readable by a computer.  The data should also be supported by a generous licensing agreement that demonstrates trust in the community.  Keep in mind that the data should be good and complete, but not perfect.  If there are issues, the community that you build will find them and tell you.

Step Two: Engage a Community of Developers

There are a number of things that need to happen here: (1) create and Application Programming Interface (API) as an invitation for developers to access and use the data; (2) advertise that the data exists, and where it is; (3) link the core data with other support data, for instance a description of what the substances are, any location information and other meta data; (4) finally create an event or competition as a means of engaging developers.  Something like and Apps for Air contest, coupled with a hack-a-thon.

Step Three: Get the Apps Out There

There are groups of smart phone and web users who love new toys.  Ensure that these folks know that some cool Air Quality Applications are being developed, and invite these early adopters (and researchers) to use the apps and to provide feedback on them.  Perhaps they can even vote on the winning application.  In this instance, it is important to engage the early adopters through the smart use of social media tools such as Facebook and Twitter.  Create a FB page, start using a Twitter hashtag, ask key members of the community for advise and help in getting the word out.  Engage and don't be afriad.

Step Four: Wider Acceptance

As the apps start making their way onto the web and possible mobile devises, more people will use them and, hopefully, two things will happen over time. Citizens will realize that they have access to cool and useful tools, and the government will slowly become more comfortable with greater openness and transparency.

Conclusion

I was asked by the expert panel about brand protection.  I believe that the best strategy to protect one's own brand is to engage with a community of people who support your goals and activities. That engagement is the best brand protection available.  It is unfortunate that, to date, the Government of Alberta is too busy yelling things that we don't believe. More listening, engagement, and trust is required.