images of our city: legislative grounds

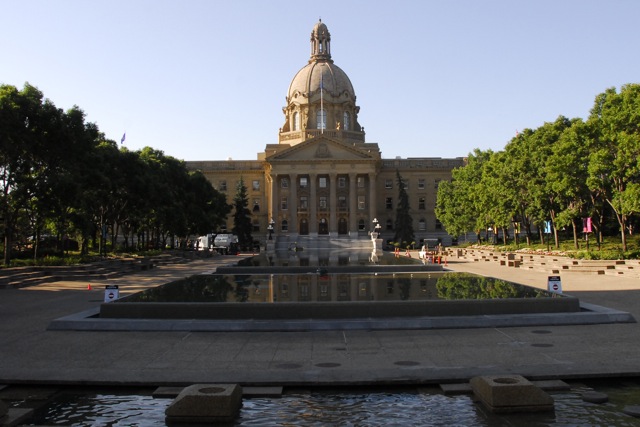
One of Edmonton's most used areas, and one of my favorite spaces, is the legislative grounds.  The ledge is iconic in Edmonton with its domed roof and spire raised over the downtown, and is visible from across the river to the south, down 108th Street and from the east as well. The Legislature Building is situated on 23 HA of parkland that represents a history going back to the late 1800's when these grounds were a 5-hole golf course.  A  history of the Legislative Grounds can be found here (PDF).

What I like about the ledge is its status in Alberta, as the seat of government, and its use by the citizens of Edmonton and Alberta. The grounds represent the diversity of people that can be found within Alberta, with symbols ranging from aboriginal (a totem pole) to Asian (Korean and Japanese symbols), including several memorials to workers and the Holocaust.

The ledge grounds are welcoming and used.  In the summer it is common to see children splashing in the pools to the north of the legislative building, as well as office workers sitting in the sun during lunch and coffee breaks.  The grounds also link the north side of the High Level Bridge with downtown, allowing pedestrians and cyclists a traffic-free alternative to their commute. Canada day is celebrated with cycling races, Christmas with lights; Hanukah and other multi-cultural events are also celebrated. Protesters also march to the steps of the legislative building to voice their concerns and disapproval.

These events are significant in that they provide the context for the grounds as being public, open, and inclusive - even democratic.  In a time when 'space' is more often private or a weird hybrid of public and private (for instance, Chapters, where you are welcome if you are willing to pretend that you have and want to spend money).  These grounds welcome everyone,  and people are empowered to experience and interact with others and the space adjacent to our elected government.

One of my biggest concerns with the legislative grounds is currently being addressed.  Given the current slate of demolitions in Edmonton, it is encouraging the see that the Federal Building is being refurbished.  The renovation began in 2008, and will be completed in 2011 in time for Alberta's 100th anniversary in 2012. The design concept of the renovation includes a west entrance pavilion re-orienting the building towards the legislative grounds and adding to the public space found on the grounds, there will be an additional 650 underground parking stalls added, and a  skating rink.

I believe that the legislative grounds provides an interesting and public connection between the riverside and the downtown core.  While the extent of the grounds, size and nature of the buildings makes this close to impossible to replicate in other parts of Edmonton, there are design elements worth considering.  The linkages between different modes or transportation (transit with a terminal on the east side of the grounds, walking, cycling, parking), activities such as splash ponds, and skating, coupled with public space make this a model to be replicated.

View Larger Map

Towards Data Driven Urbanism

We’re a city of nearly 800,000 people, and we’re basing the public involvement part of the decision on 80 comment forms and 15 interviews? I truly believe more people want to provide feedback, it’s just too difficult to do so at the moment. Mack Male, in a blog on Public Involvement.

A recent blog post in the Charette.ca discussed the idea of DYI Revitalisation, where a bunch of citizens, business owners and associations get together to host evens such as the 104 Street Block Party.  There are several benefits that arise from closing down a few blocks of a downtown street that include building a sense of community, connecting citizens with the local business, artests, musicians, each other. While the 104 Street Block Party is an awesome event that highlights what a place can be, it is a shallow way to engage citizens in a meaningful discussion of urban planning and development. In my view there are four practical "levels" that citizens can be engaged on: (1) a Charette where citizens attend municipally sponsored meets that address specific issues such as the Walter Dale Bridge Project, or the Arena; (2) DYI Revitalisation such as the 104 Street Block Party; (3) Tactical Urbanism, and ;(4) Data Driven Urbanism. We need all four to successfully engage citizens and municipalities, but we are currently operating at the first and second levels.

Tactical Urbanism (TU) is much like open source software development which seeks to produce consistent but incremental change over time.  This requires frequent releases involving input from all who are interested in specific local projects. TU is implemented in an urban environment through experimentation (i.e. a single $500 bench rather than $10000 worth of benches) that supports (requires) feedback from citizens. Citizens are also empowered to claim their own space with paint and small infrastructure improvements (putting in a local bike lane, speed bump). The goal is to get people involved with the local through "a deliberate and sometimes experimental phased approach to instigating change. The result is the development of desirable locations and social capital between citizens, local government and businesses."

Data Driven Urbanism (DU) recognizes that the world of citizen engagement is changing with mobile devises proliferating our urban fabric even as the GeoWeb develops as a platform that enables crowdsourced mapping.  DU recognizes that truly participatory planning must go beyond drawing on flip charts and maps and  requires a plethora of open data sets, a platform of engagement and building long term relationships with developers and engaged citizens.  What would it look like if we could GeoTweet a downed tree in a river valley path such that the River Valley Rangers received it; that these tweets were mapped?  Now imagine if we could use the tools in our pockets - iPhones, BlackBerries and all other GPS, camera and connected mobile devises to provide feedback to our Municipality on what works and what does not.  While there are privacy and behaviour concerns, these concerns are navigable and can be addressed.

The gap, as I see it, is a City wide strategy to address public involvement using new technologies and approaches.  As great as the IT department is (and they are great!), they are too few to enact widespread change within the City of Edmonton bureaucracy. Immediate improvements that could be made tomorrow include higher standards for developers.  For instance, why are they not required to produce 3D files for Google Earth that would allow citizens to engage with a developers vision? Why are public consultations limited to old style Charette, surveys and questionnaires?  It is possible and desirable to engage with citizens via an on-line map that supports geo-located comments, wikis or discussion forums.

Within geography it is commonly understood that people are experts of their local environment.  Lets engage with all who would have something to say about their locality via different and varied channels that include face-to-face meetings in addition to web-based consultations. The combined technologies of smart phones and the web as a consultation platform would offer a data driven approach to urbanism that might provide insight into what makes a location a place.

Urban GeoWeb 1

This is an inaugural post, the first of a series that will explore the intersection of the Urban with the GeoWeb and Social Computing.  My interest is specific to data visualisation, collaboration and access to resources that will enrich citizens experience living and working in urban environments.  The GeoWeb is emerging (has emerged?) as a dominant platform by which people consume, generate and communicate spatially relevant information that is a reflection of their use and experience interacting with urban areas. Social Computing is that cloud of information and people / groups that surrounds us all, and that we access via a mobile devise or computer.

Transit is an obvious way to incorporate several data streams - open transit data which describes the bus schedule and bus stop locations, potentially GPS from individual buses - all displayed on an interactive map interface that supports queries.  This is standard.  Mapnificent is not standard as it displays all of the Google enabled transit maps in the world, and provide the user travel times.  TripTropNYC creates a travel time heat map from any location of New York. Boston's Street Bump app utilises a smart phone's GPS and accelerometer to provide a realtime view of the state of Boston's roads.    I love this this type of application development is seeking to crowdsource, through citizen based sensors, less expensive ways to track urban infrastructure.

Sustainable Cities Collective expands on this theme by discussing WikiCity as a way to engage citizens in city improvement:

Local groups all around the world are taking the initiative and are building the infrastructure that governments refuse or are slow to do.

Charlie Williams, an UK based artist, has created some very cool looking Air Boxes which provide realtime feedback to citizens on the quality of their air.  These boxes sit at street level and simply shows a red, orange, or green graphic depending on the quality of the air.

Finally, the  MIT Sensable City Lab hosted a Future Cities forum that brought together a number of leading thinkers, including Carlo Ratti the Lab's director, to discuss future cities.  The video of these talks can be found here.

I'll close with these words from the Future Cites website:

Over the next few decades, the world is preparing to build more urban fabric than has been built by humanity ever before. At the same time, new technologies are disrupting the traditional principles of city making and urban living. This new condition necessitates the creation of innovative partnerships between government, academia, and industry to meet tomorrow's challenges including higher sustainability, better use of resources and infrastructure, and improved equity and quality of life.


Alberta's Expert Monitoring Panel

Last week I responded to an open call by Alberta's Expert Monitoring Panel to present my take on the following questions:

1. What should a world class environmental monitoring system look like? 2. What type of organization should manage and operate the proposed environmental monitoring evaluation and reporting system? 3. What kind of information should the environmental monitoring system produce? 4. How should the environmental monitoring system be funded? 5. Do you have any further suggestions or advice to help the Panel as they develop recommendations for a world-class environmental monitoring system?

As I didn't feel that I could adequately address each question, my presentation and argument focuses on components of Q1 and Q2.  This blog post will focus on the Open Data aspects of Q2.  My full presentation can be found here: Presentation to Alberta Environment Expert Panel on AAQM.

Slide #5 outlines the 3 Laws of Open Data as proposed by David Eaves, Slide #6 outlines the process of turing open data into a community good.  Open Data is important in this context as it has the potential to engage a broader base of citizens in a conversation that is normally limited and closed.  While engagement is possible it does not happen quickly or easily.  If there was a formal process for turning open data into community engagement, it might like this:

Step One: Create An Open Data Catalogue

This open data catalogue should be indexed such that it can be found and formatted such that the data is readable by a computer.  The data should also be supported by a generous licensing agreement that demonstrates trust in the community.  Keep in mind that the data should be good and complete, but not perfect.  If there are issues, the community that you build will find them and tell you.

Step Two: Engage a Community of Developers

There are a number of things that need to happen here: (1) create and Application Programming Interface (API) as an invitation for developers to access and use the data; (2) advertise that the data exists, and where it is; (3) link the core data with other support data, for instance a description of what the substances are, any location information and other meta data; (4) finally create an event or competition as a means of engaging developers.  Something like and Apps for Air contest, coupled with a hack-a-thon.

Step Three: Get the Apps Out There

There are groups of smart phone and web users who love new toys.  Ensure that these folks know that some cool Air Quality Applications are being developed, and invite these early adopters (and researchers) to use the apps and to provide feedback on them.  Perhaps they can even vote on the winning application.  In this instance, it is important to engage the early adopters through the smart use of social media tools such as Facebook and Twitter.  Create a FB page, start using a Twitter hashtag, ask key members of the community for advise and help in getting the word out.  Engage and don't be afriad.

Step Four: Wider Acceptance

As the apps start making their way onto the web and possible mobile devises, more people will use them and, hopefully, two things will happen over time. Citizens will realize that they have access to cool and useful tools, and the government will slowly become more comfortable with greater openness and transparency.

Conclusion

I was asked by the expert panel about brand protection.  I believe that the best strategy to protect one's own brand is to engage with a community of people who support your goals and activities. That engagement is the best brand protection available.  It is unfortunate that, to date, the Government of Alberta is too busy yelling things that we don't believe. More listening, engagement, and trust is required.

A more intelligent Edmonton?

Edmonton is on the cusp of great change. We are moving forward with an expanded LRT line, contemplating (seriously contemplating) building a downtown stadium for the Edmonton Oilers, and building a whole new community on the Municipal Airport Lands. For good or bad (likely good AND bad) we are moving forward and perhaps coming into our own as a major prairie urban center. I feel, though, that this change is in some regards being made with little understanding of the broader context, and that this context isn’t even on the radar in a meaningful way. Let me explain what I mean by this. For me, the best way to understanding something is to try and collect data and explore what those data are saying. And I think that this change is going to generate a lot of data – if we have the foresight and will to collect it over the longer term. Given my predilections towards humanities research and interest in air quality, I propose that we create a three-pronged network of monitors to help us understand the impact of change on Edmonton’s people, build environment, and air quality.

Edmonton’s People Edmonton is home to a great and increasing diversity of people who are impacted by ‘development’ in vastly different ways. For instance, business owners within the downtown core may have a different understanding of the potential benefits associated with a downtown arena than the working poor or other who use the Boyle Street services. The same is true for someone who lives in Riverbend, or downtown. The media is limited in the number of stories that can be printed, and the number of views that can be expressed. But there is another way to include more voices in the debate and as a record of impressions of change. What would it look like to document, through short-recorded interviews, the impressions that this diversity of people has regarding the change that we are seeing? These recordings could be grouped on a web-based map based on the location of the project being discussed. Over time a comprehensive public record could be created.

Edmonton’s Build Environment We are planning some large and impressive projects over the coming years and it would be a shame not to document, in detail, how these projects unfold. Interviewing Edmonton’s People is one approach to documenting these changes, and photographing the changes to the build environment is another approach. But rather than capture these changes with static one-off photos, we could with some thought, engage in a long-term photography project to run in conjunction with the interview project. There are several components to consider: Cowdsource: We can create a Flickr group and encourage citizens to upload their photos here with a geo- and other tags to help sort and understand the context. Time-lapse: Set up a number of self sustaining time-lapse rigs focused on key areas of development (the arena, the municipal airport lands, LRT routes) and let these cameras do their work. A picture a day (or two, or three…) over the course of a year will be a great resource into the future.

Edmonton’s Air Quality Establish a network of volunteers to travel through the city with mobile air quality sensors (there are options with this technology – MIT’s Copenhagen Wheel, or http://sensaris.com/product.html). Current monitoring practice has three sensors in Edmonton, one in the downtown core, located on top of a building. Mobile sensors would offer three benefits over the sensors run by Alberta Environment. (1) Real time data that (2) reflects the quality of the air we breathe rather than the AQ on top of a building in (3) locations that we are concerned about.

There is a lot of room to improve the real monitoring of Edmonton, including perceptions of people, changes in the built environment, and changes in environmental quality. To fully understand how change impacts these things, we should start building out understanding of the current (baseline) data soon.

Sense making and storytelling.

One of the limitations to the technology I work with is the inability for users make-sense (sensemaking) of multiple and varied data streams within a mapping or other virtual environment.  For instance, within a virtual map space, data may be available that represents map elements in a point, line, polygon or 3D object format.  Data may also be available from a sensor network that provides parameters related to environmental or weather indicators, historic or archieved data may also be available, and finally citizens may have hand held sensors or some personal insight / experience with specific locations.  How can all of this data be combined to tell a compelling and accurate story of place? This Ushahidi blog provides some interesting links and a compelling story related to personal or organisational narrative where patterns and inferences about content can be made:

http://blog.ushahidi.com/index.php/2011/02/15/hearing-need-and-seeing-change-through-story-cycles/

Imagine collecting thousands of stories like the one above from citizens, community organizers, and NGO staff about what really matters to them … and where change is showing. Now imagine looking through a prism at these stories to find patterns and compare and contrast patterns between community efforts, organisations, burning issues, locations, citizens of different ages, and more.

I find this to be very compelling and interesting.  And its a solid step towards creating a sense-making environment where varied data types can be combined.